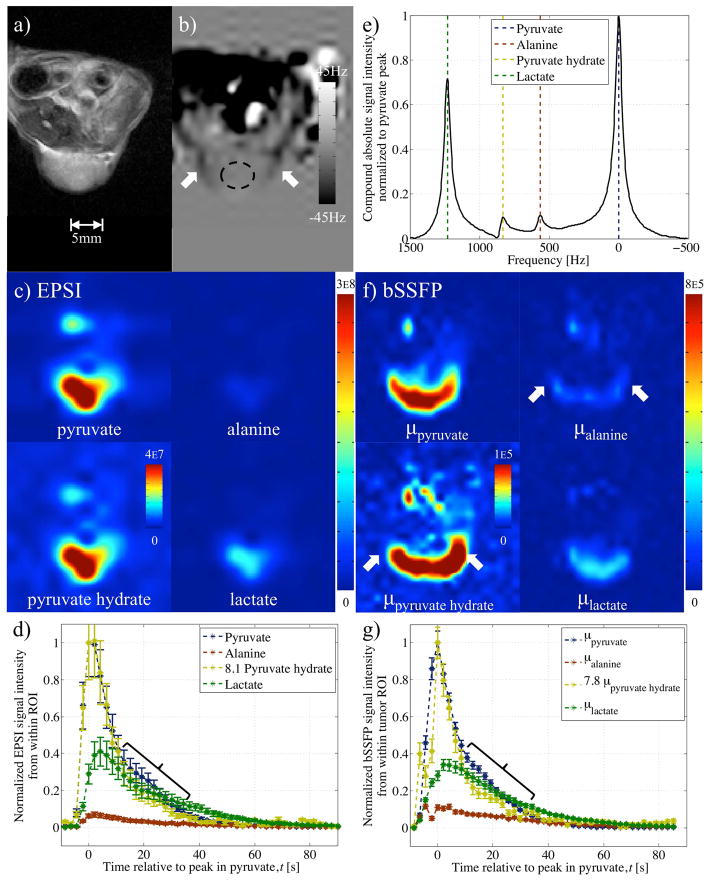
Figure 7.
Results from in-vivo experiment 3 comparing EPSI and variable phase advance bSSFP in A498 cell line xenograft tumor model following injection of hyperpolarized pyruvate. Images from: a) proton RARE serve as reference; and b) field-map acquisition used during reconstruction of variable phase advance bSSFP data. Data from EPSI: c) reconstructed into separate metabolic images at the peak in pyruvate time point; d) used to form dynamic plots based on the signal from a ROI within the tumor; and, e) reconstructed into spectra with the sum over the entire experiment plot using odd echoes only. Multiplication of pyruvate hydrate signal by 8.1 (based on peak in pyruvate) in (d) to emphasize consistency with pyruvate time course Similar f) metabolite images and g) dynamic plots were produced from bSSFP data in the same mouse. Unusual points of hyper-intense alanine and pyruvate hydrate signals coincided with hypo-intensities in the field-map (white arrows). Dynamic signal from pyruvate hydrate in (g) multiplied by 7.8 (based on peak value) shows similar correspondence with pyruvate as for EPSI results, in (d), including deviation from pyruvate at time points encompassed by braces.

