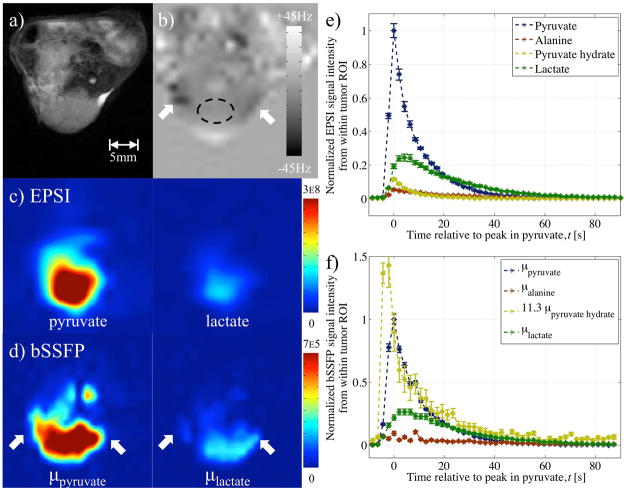
Figure 8.
EPSI and variable phase advance bSSFP data in A498 cell line xenograft tumor model following injection of hyperpolarized pyruvate (in-vivo experiment 4). Images from a) proton RARE and b) field-map acquisition (with ROI) serve as reference. Reconstructed pyruvate and lactate metabolite images from c) EPSI and d) variable phase advance bSSFP data (using the field-map to inform on any local off-resonance) interpolated (bicubic) to the same resolution shows spatial distribution. Plots of the signal from a ROI within the tumor using e) EPSI and f) variable phase advance bSSFP data provides dynamic information. Plot of dynamic signal from pyruvate hydrate in (f) multiplied by 11.3 based on linear least squares fit to pyruvate time course.

