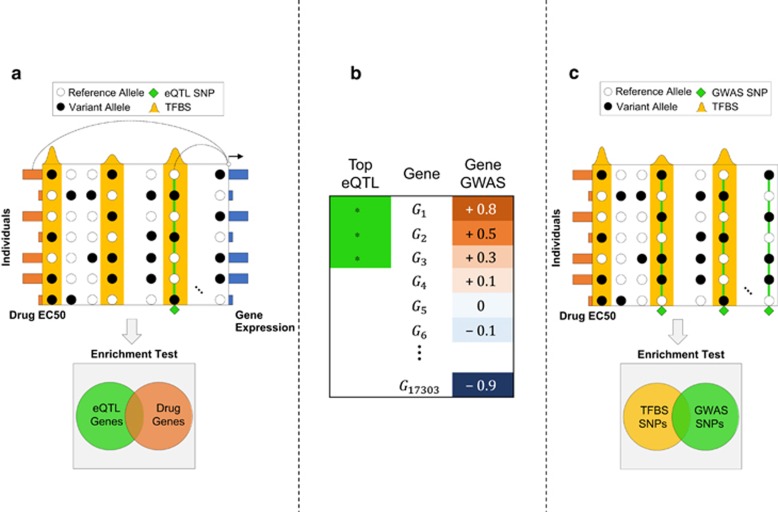
Figure 2.
(a) The GENMi (Gene Expression iN the Middle) method. Shown is the 50 kb upstream region of a single gene, with transcription factor-binding site (TFBS; ChIP peaks) in yellow, single-nucleotide polymorphisms (SNPs; circles) and their allelic state (black or white) in a sample of seven individuals, as well as gene expression (blue bars on right) and drug response EC50 values (orange bars on left) in these individuals. The gene is scored in two ways : correlation of the best expression quantitative trait locus (eQTL) SNP (green diamond) coincident with a TFBS and correlation of the gene's expression with drug response (these two correlations are illustrated by lines connecting the two correlated variables). Integrating over all genes, testing the overlap between strongest eQTL genes and genes associated with drug response (enrichment test, bottom) quantifies the extent to which a TF is associated with drug response via cis-regulatory mechanisms. (b) Cartoon of Gene Set Enrichment Analysis (GSEA) used as the enrichment test in GENMi. Genes are ranked according to their correlation with drug response (‘gene GWAS'). The analysis looks at the extent to which a given gene set (in this case genes carrying the strongest eQTLs coincident with the TFBS) are enriched near the top or bottom of the ranked list. Here, the gene set is strongly associated with genes positively associated with drug EC50 values. (c) Baseline method that does not use expression data. Shown are SNPs (columns) distributed throughout the genome within TFBS (yellow peaks) and outside. Genome-wide association study (GWAS) SNPs (green diamonds) correlated with drug response across individuals (rows) are tested for enrichment with within-TFBS SNPs to determine whether a TF is associated with drug response.

