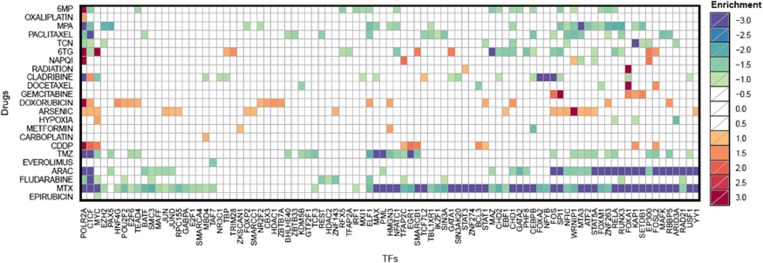
Figure 3.
Significant (transcription factor (TF), treatment) associations. Shown are the log-transformed false discovery rate (FDR) values for all associations meeting FDR ≤0.1. The green–blue range refers to enrichment for genes whose expression negatively correlates with cytotoxicity, and the yellow–red range indicates enrichment of genes whose expression positively correlates with cytotoxicity. The yellow–red log-transformed FDR values are multiplied by negative 1, creating the −3 to 3 range in the legend enrichment. Anything with an FDR ≥0.1 is shown as white.

