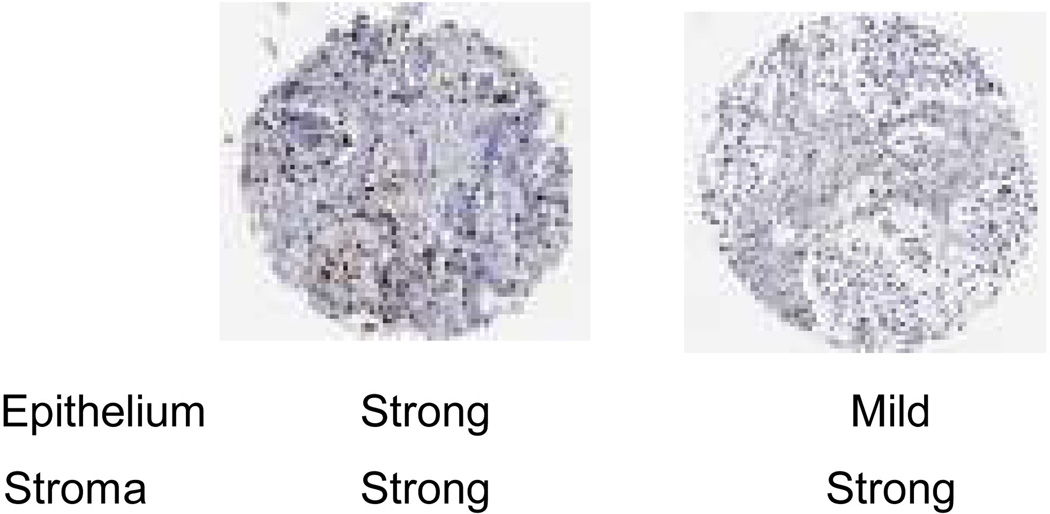
Figure 2.
Classification of eosinophil peroxidase protein expression in tumor epithelium and stroma of tissue microarray cores in two colorectal cancer patients. The eoinsophil scores were quantified as follows: 1 – non-detected; mild (2 – 1–5 eosinophils per 0.28 mm2); 3 – moderate (6–10 eosinophils per 0.28 mm2); 4 – strong infiltration (≥10 eosinophils per 0.28 mm2).

