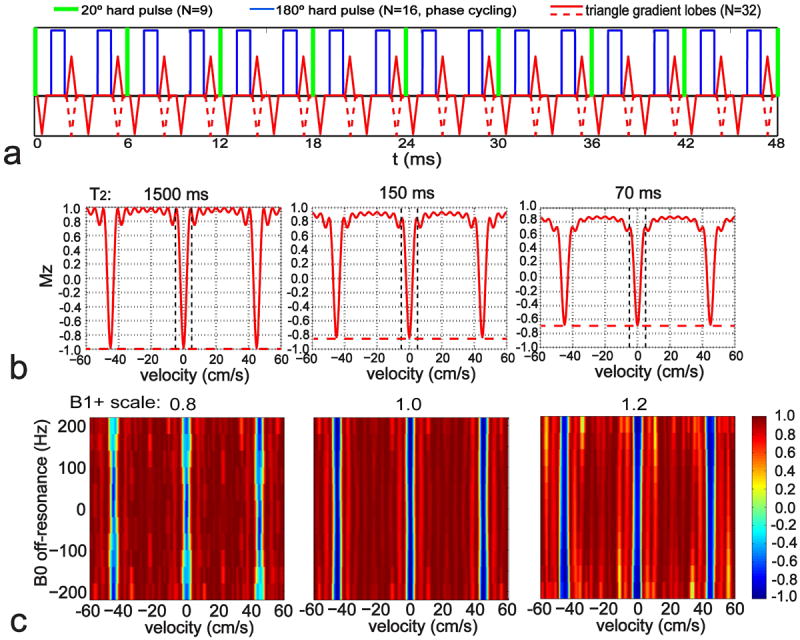
Figure 1.

(a) Diagram of the FT-VSI pulse train with paired and phase-cycled refocusing pulses in each velocity encoding step, gradients with alternating polarity surrounding refocusing pulses for velocity-sensitized waveform (red solid lines) and uni-polar gradients for velocity-compensated waveform (red dashed lines for the polarity-switched gradient lobes). (b) The simulated Mz-Velocity responses of the pulse (a) with different T2 relaxation effects: 1500 ms (CSF), 150 ms (arterial blood), and 70 ms (tissue). The vertical dashed lines indicate the inversion band (±4 cm/s). The horizontal dashed lines illustrate the universal inversion response of the FT-VSI pulse train for the control scan. (c) The simulated Mz-velocity responses of the labeling pulse (a) at different B0 conditions with representative B1+ scales of 0.8, 1.0, and 1.2.
