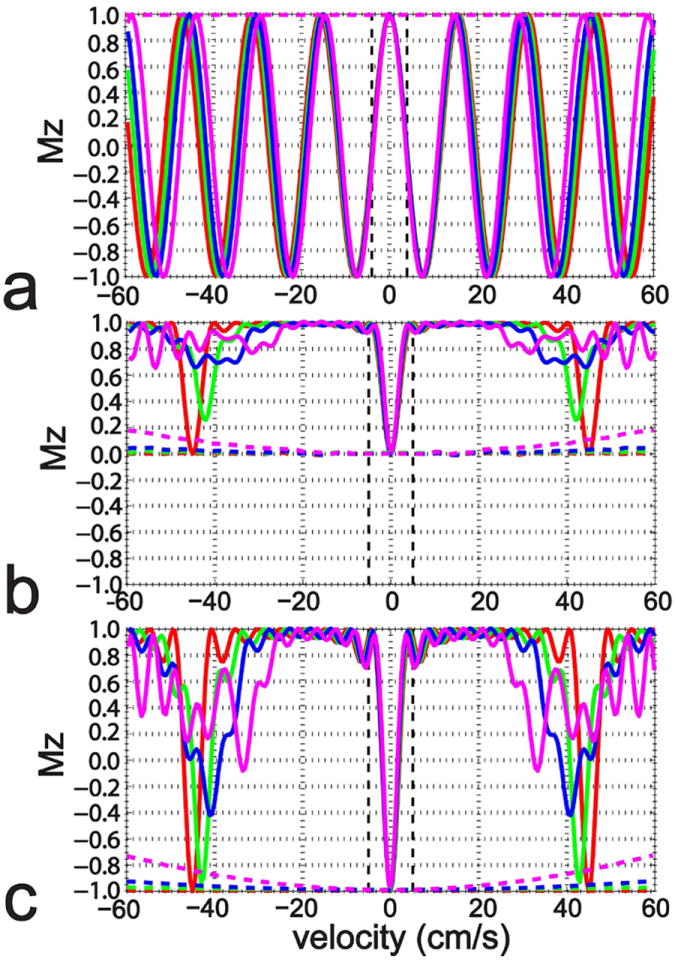
Figure 2.

The simulated Mz-velocity responses of the 20 ms DRHT (a), 64 ms FT-VSS (b), and 48 ms FT-VSI pulse trains (c) when encountering linear temporal velocity changes within 50 ms: constant velocities (red), from 95% to 105% (green), from 90% to 110% (blue), and from 80% to 120% (magenta). The dashed lines illustrate the responses for the control scans of these three pulse trains. No B0 or B1+ inhomogeneity or T2 effects were included in this simulation.
