
Figure 4.
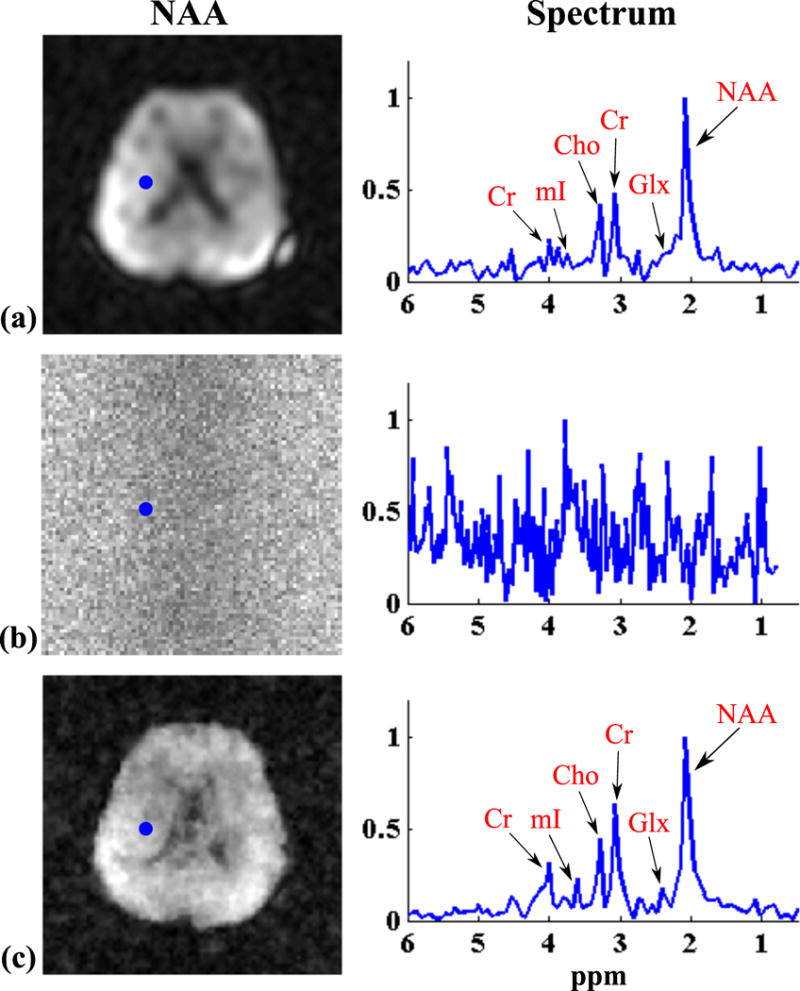
Experimental results from the metabolite phantom obtained by a 24 × 24 CSI and an 80 × 80 SPICE with equivalent data acquisition time. The GRE image in (a) shows the structural arrangement of the phantom. The images in (b) compare the spatial maps (obtained by peak integral) of NAA (first column), Cr (second column), Cho (third column) and mI (fourth column) for CSI (top row) and SPICE (bottom row). The NAA maps were normalized such that the maximum intensity is 1 (for both CSI and SPICE), while the other metabolite maps were normalized to the NAA maps. All reconstructions were zero-filled to 110 × 110 grids. The images in (c) show spectra from the three numbered voxels indicated in (a) for CSI (red) and SPICE (blue). Each spectrum was normalized to its maximum value individually.