
Figure 9.
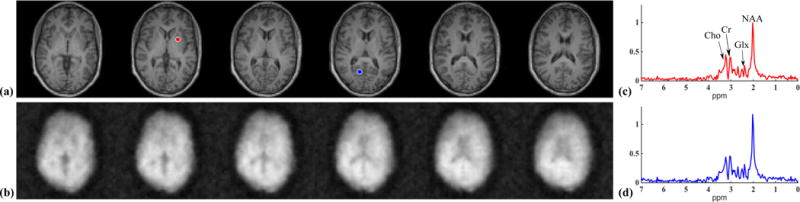
Results from a 10 min 2D-SPICE acquisition: (a) the T1-weighted image (T1w); (b) the spatial maps of different metabolites (NAA, Glx and Cr) produced by the SPICE reconstruction corresponding to the same slice (as in a); (c) representative spectra selected from the voxels indicated by the blue dots in (a). The metabolite maps were normalized individually, color-coded and overlaid on the T1-weighted image.