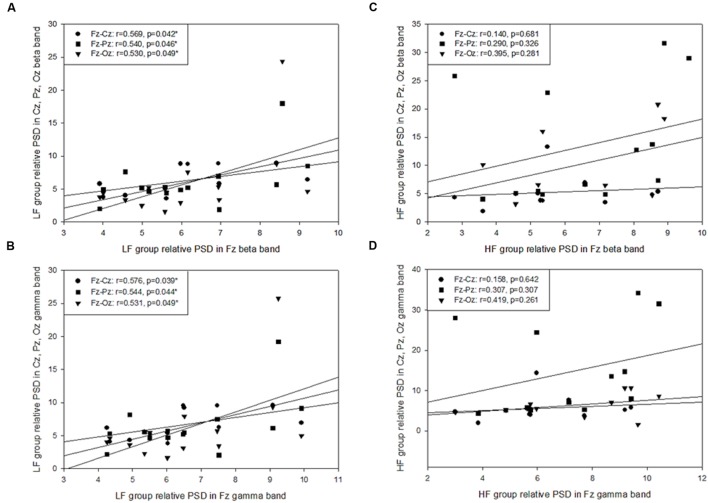
FIGURE 5.
Pearson’s correlation coefficient analysis of the posture-related cortex regions during the platform recovery phase with virtual reality interference. The LF group demonstrated a significant correlation at Fz site and other regions in (A) the beta band and (B) the gamma band; however, there was no relationship found during the platform recovery phase among the HF group (C,D).

