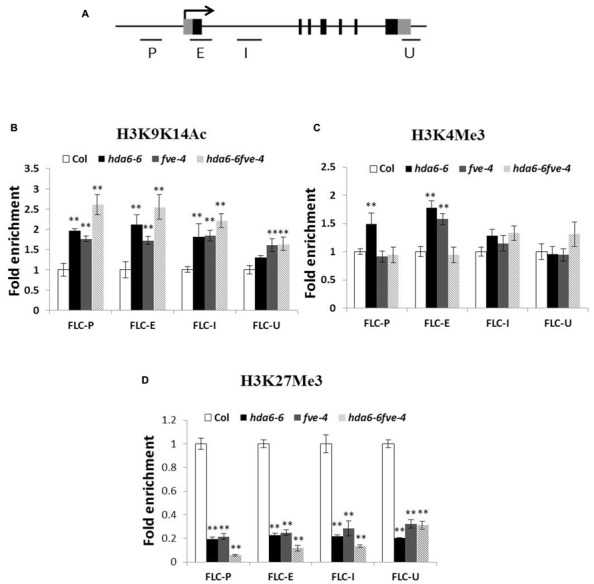
FIGURE 3.

Histone modification levels of FLC chromatin in hda6-6, fve-4, and hda6-6fve-4 mutants. (A) Schematic structure of genomic sequences of FLC and the regions examined by ChIP. (B–D) Relative levels of H3K9K14Ac (B), H3K4Me3 (C), and H3K27Me3 (D) of FLC in Col, hda6-6, fve-4, and hda6-6 fve-4 seedlings grown under LD condition for 10 days. ** Double asterisks denote statistical significance P < 0.01 (t-test).
