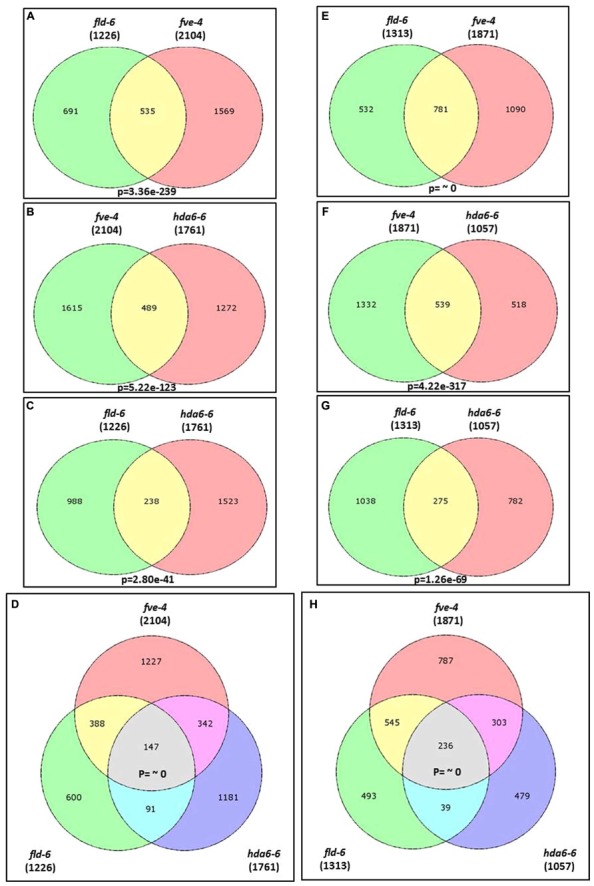
FIGURE 4.

Transcriptome profiles of fve-4, fld-6 and hda6-6 mutants. (A–D) Venn diagrams showing the number of genes up-regulated (>twofold, p-value < 0.05) in fve-4, fld-6, and hda6-6 mutants by using RNA-sequencing analysis. (E–H). The number of genes down-regulated (<twofold, p-value < 0.05) in fve-4, fld-6, and hda6-6 mutants. Numbers in parentheses represent the total numbers of up- or down-regulated genes in the respective mutants. The P-value of the Venn diagram (A–C and E–G) was calculated using the hypergeometric distribution. (D,H) Simulation-based P-values were calculated via R project.
