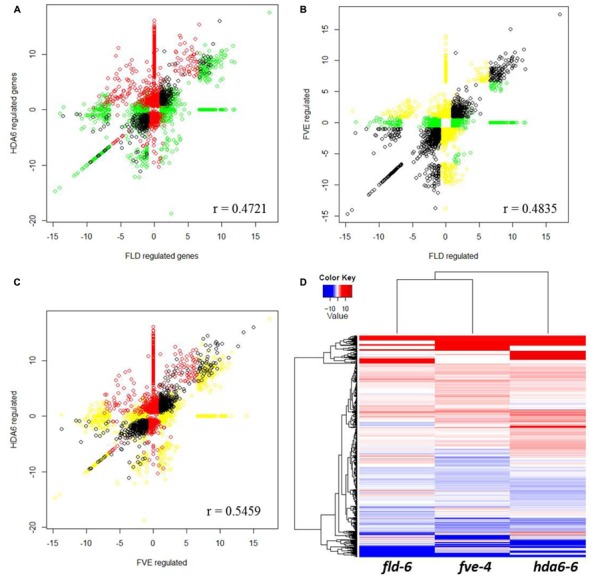
FIGURE 6.

Scatterplot analysis of FVE, FLD, and HDA6 regulated genes. (A–C) Correlation by scatterplot of log2 fold change values between HDA6 and FLD regulated genes (A), FVE and FLD regulated genes (B) and HDA6 and FVE regulated genes (C). Correlation coefficient was calculated and shown in figure. (D) Transcriptional profiles comparisons represented as a heatmap to highlight up-regulated (red) and down-regulated (blue) genes in fve-4, fld-6, and hda6-6 mutants.
