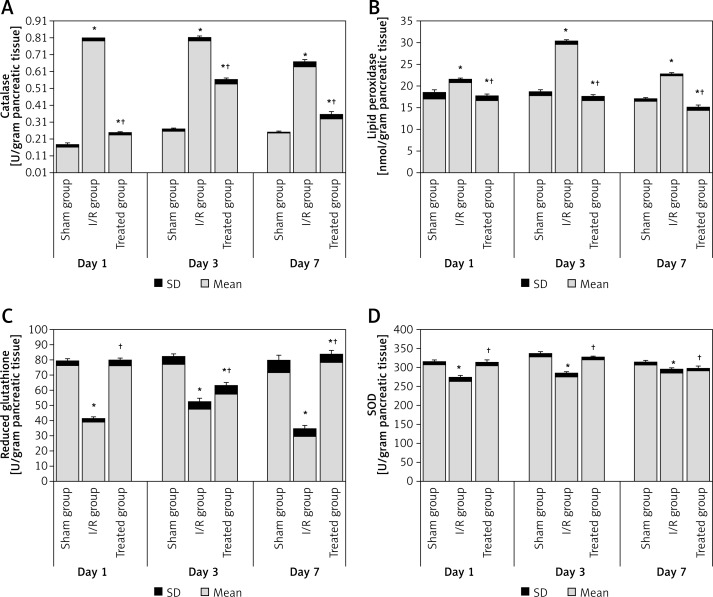
Figure 1.
Pancreatic oxidative stress level in the study groups: A – catalase, B – lipid peroxidase, C – reduced glutathione, D – SOD. All data are expressed as mean ± SD and were analyzed using one-way ANOVA and Bonferroni post-hoc test
*Compared to sham group at p < 0.05. †Compared to I/R group at p < 0.05.

