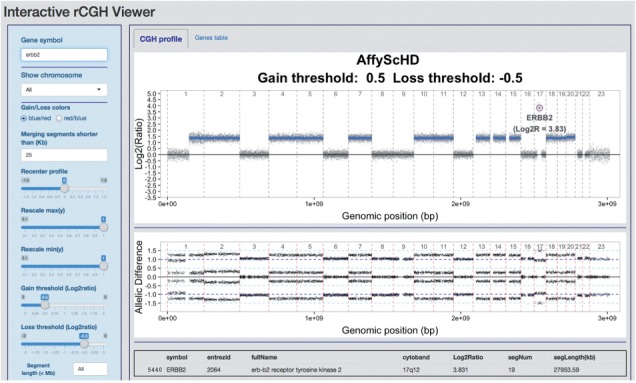
Fig. 1.

. Interactive visualization. The genomic profile and the loss of heterozygosity profile (when available) are displayed on the CGH profile tab, while the gene values are accessible through the Genes table tab. The command panel (on left) can be used to display a gene of interest, to recenter the entire profile and to specify several decision parameters (gain/loss threshold, segment length). Gene values are updated automatically, and profiles and table can be re-exported after modification
