Figure 1.

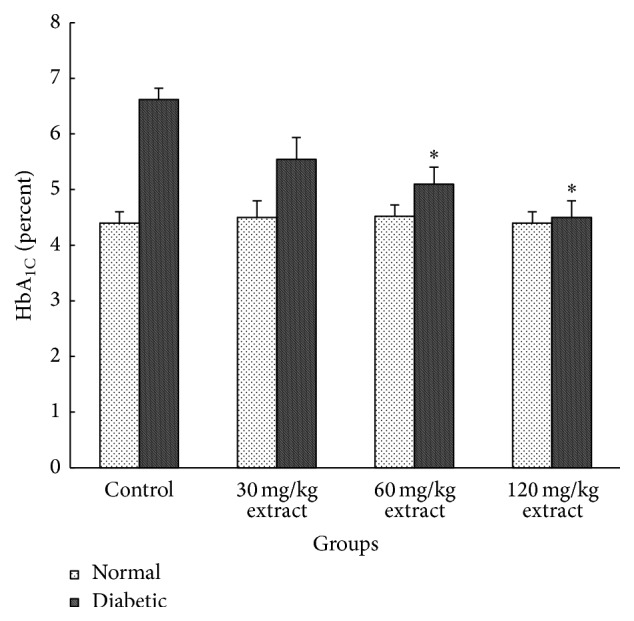
The mean value of HbA1C in all different groups (data are shown in mean ± SEM, n = 8). ∗ P < 0.01 in comparison with control diabetic group.

The mean value of HbA1C in all different groups (data are shown in mean ± SEM, n = 8). ∗ P < 0.01 in comparison with control diabetic group.