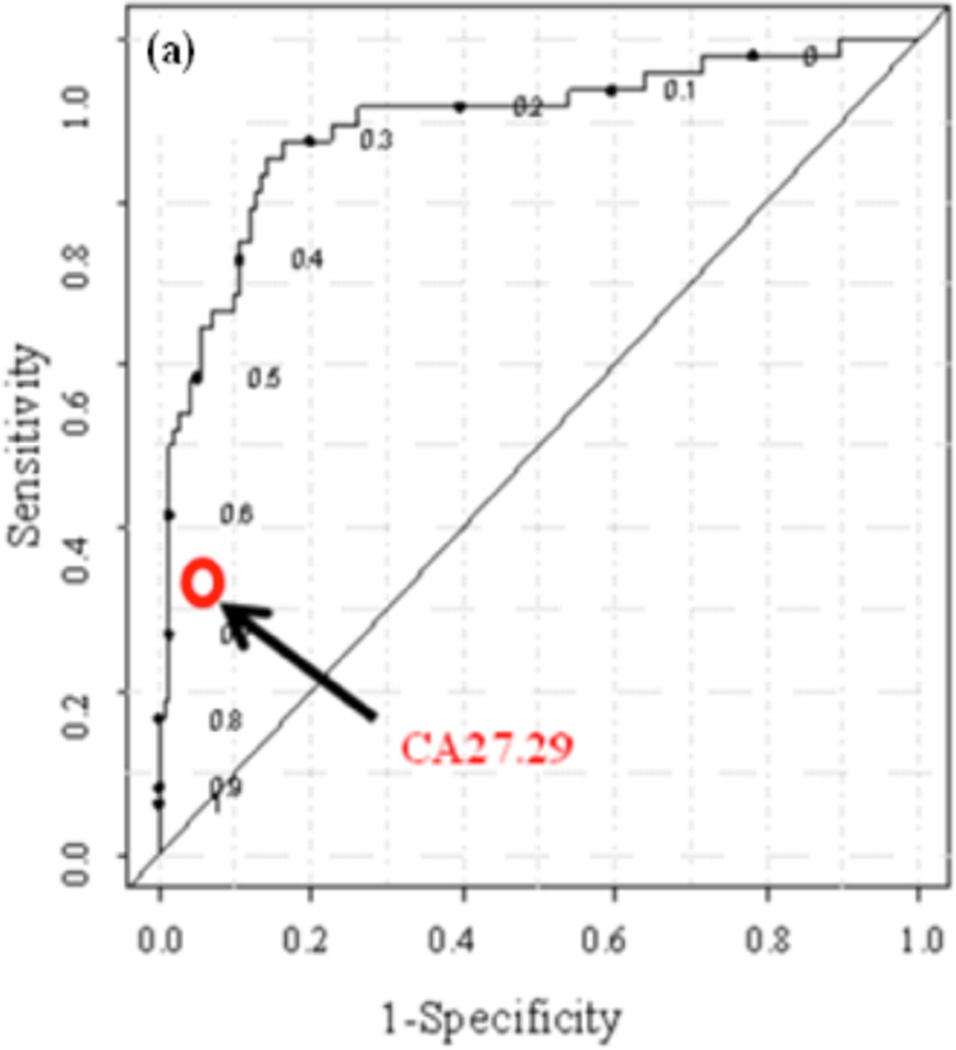
Fig. (3).
(a) ROC curve generated from the PLS-DA model based on eleven serum metabolite markers for detection of breast cancer recurrence; the model was cross validated using a leave-one-patient-out procedure. The red circle compares the sensitivity and specificity for the conventional breast cancer marker used for recurrence test. The area under the ROC curve is 0.88. The sensitivity and specificity at two selected cutoff values are shown in Table 1 [Reproduced with permission from ref. 105].

