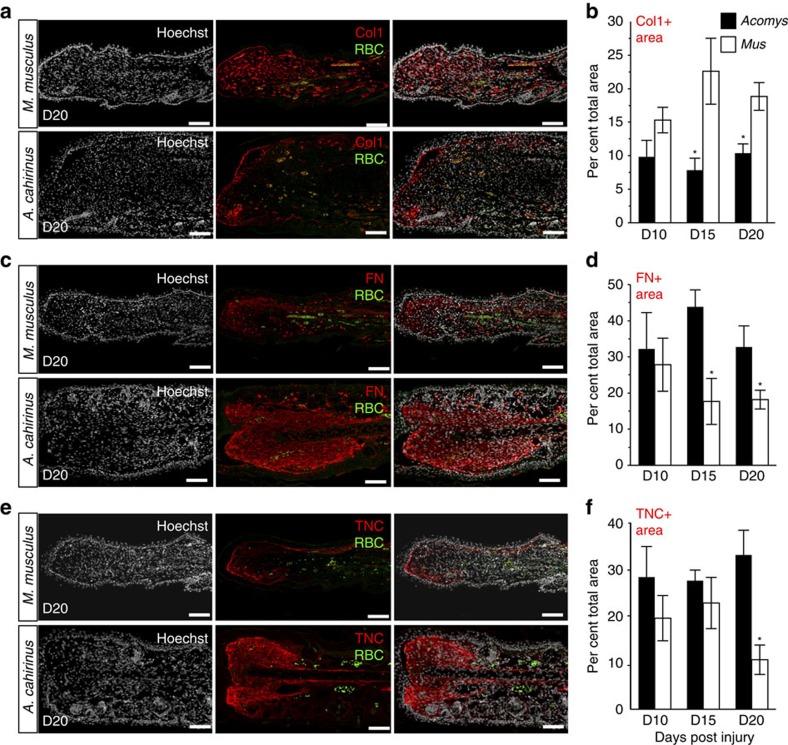
Figure 6. Immunostaining for the extracellular matrix proteins reveals differences in the total area of protein deposition.
(a,c,e) Representative images for immunohistochemistry to detect collagen I (Col1) (a), fibronectin (FN) (c) and tenascin (TNC) (e) in M. musculus and A. cahirinus. Nuclei were counterstained with Hoechst (grey), antigen was detected by fluorescent secondary antibody (red), autofluorescent red blood cells (RBC) (green). (b,d,f) To quantify positive signal, a region of interest was created to include tissue distal to the original cartilage and to exclude hair follicles and epidermis. The ratio of total immuno-positive area per total area of the region of interest was calculated. Data represent mean and s.e.m., *t-test P<0.05 for M. musculus versus A. cahirinus comparison for the day indicated. One representative image per stain is shown; n=4 biological replicates per species per time point. Scale bar, 100 μm.

