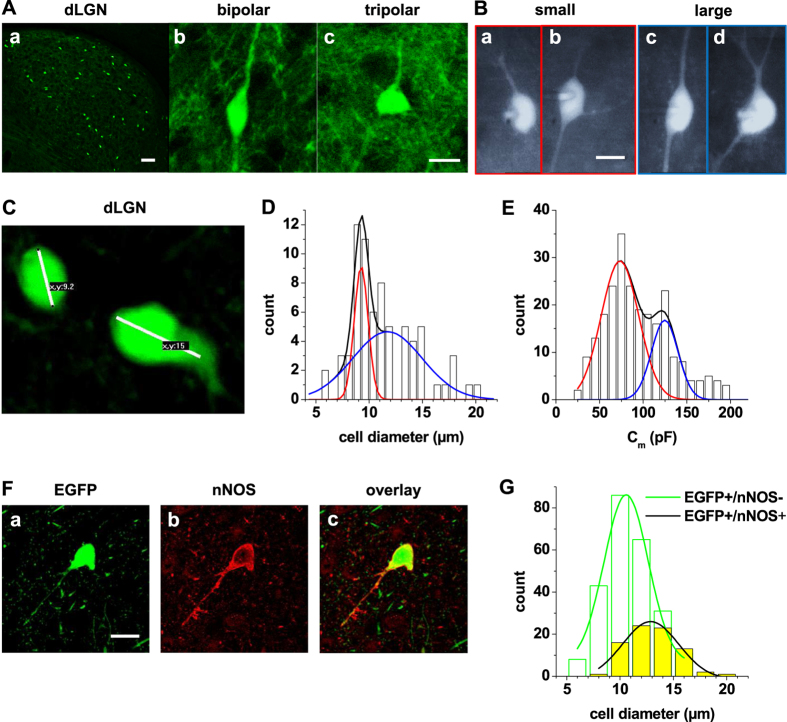
Figure 1. Size distribution and nNOS expression of EGFP-labeled IN in dLGN.
(A) Coronal section of dLGN from a P21 GAD67-EGFP mouse revealing the scattered distribution of IN (Aa; scale bar 100 μm). Higher spatial resolution images revealed spindle-shaped (Ab) and tripolar (Ac); scale bar 10 μm) neurons. (B) Fluorescent images of patched IN showing small (Ba,Bb) and large (Bc,Bd) cells with both shapes (scale bar 10 μm). (C) Confocal image of two EGFP-expressing IN in dLGN with software based determination of cell diameters indicating the presence of small and large cells. (D) Size-frequency distribution of soma diameters of EGFP-expressing IN. The histogram was obtained from the two-dimensional analysis of the somatic diameter. The ordinate represents the number of cells within each 0.75 μm diameter class along the abscissa. Note the bimodal size distributions for the total IN population in dLGN. (E) Frequency distribution of membrane capacitance of EGFP-expressing IN recorded under current clamp conditions. The ordinate represents the number of cells within each 10 pF class along the abscissa. Note the bimodal membrane capacitance distributions for the total IN population in dLGN. (F) Immunofluorescent staining for the presence of nNOS (Fb) in EGFP-expressing cells (Fa) in dLGN. The overlay (Fc) reveals co-expression in a fraction of IN. Scale bar represents 15 μm. (G) Size-frequency distribution of soma diameters of cells only expressing EGFP (green bars) and cells double-labeled for EGFP and nNOS (yellow bars). The histogram was obtained from the two-dimensional analysis of the somatic diameter. The ordinate represents the number of cells within each 2 μm diameter class along the abscissa. Solid lines represent Gauss fits to the data points. Please note that nNOS positive IN tend to have larger soma diameters.

