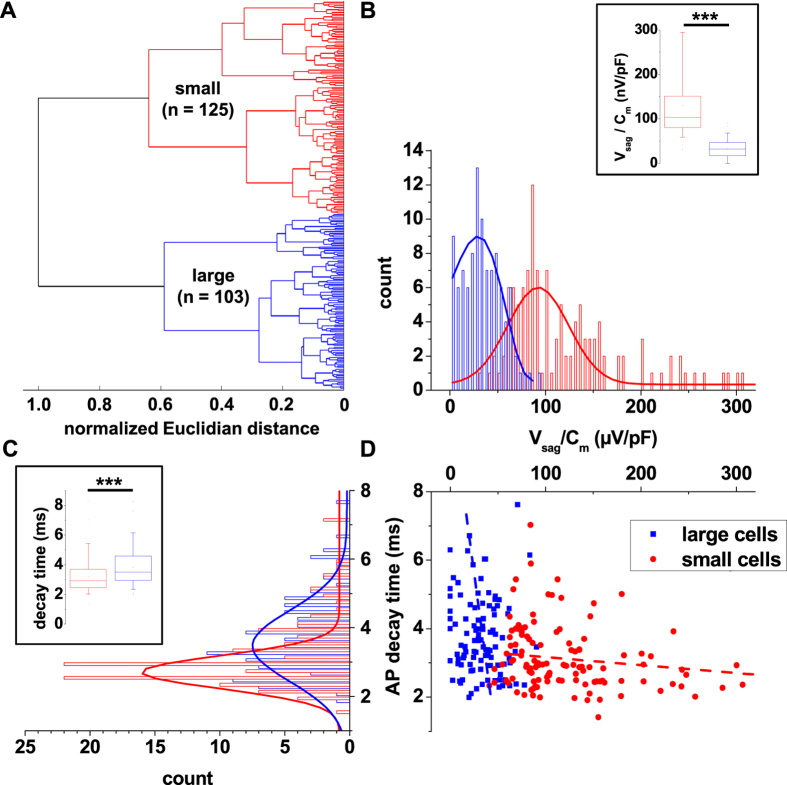
Figure 2. Cluster analysis classification of EGFP-expressing IN in dLGN.
(A) Ward’s unsupervised analysis was used with physiological parameters from Tab. S1 to classify 228 EGFP-labeled IN. The cut-off value at the normalized Eulclidian distance of 0.7 (i.e., 70% the maximal Euclidian distance) separated the dendrogram into small and large neurons. (B) The frequency distribution of the amplitude of the Vsag amplitude normalized to cell size (voltage sag amplitude divided by membrane capacitance) of EGFP-expressing IN after K-means correction revealed two populations of cells (bin size 5 μV/pF). Solid lines represent Gauss functions fitted to the data points. The inset shows the box plot representation of this parameter (t-test, two tailed: p < 0.001). (C) The frequency distribution of the decay time of the first AP induced by a positive current step (+80 pA) of GFP-expressing IN after K-means correction revealed two populations of cells (bin size 0.2 ms). Solid lines represent Gauss functions fitted to the data points. The inset shows the box plot representation of this parameter (t-test, two tailed: p < 0.001). (D) Scatter plot depicting the normalized voltage sag vs. AP decay time for each IN included for cluster analysis after K-means correction. Two cell populations are clearly visible.

