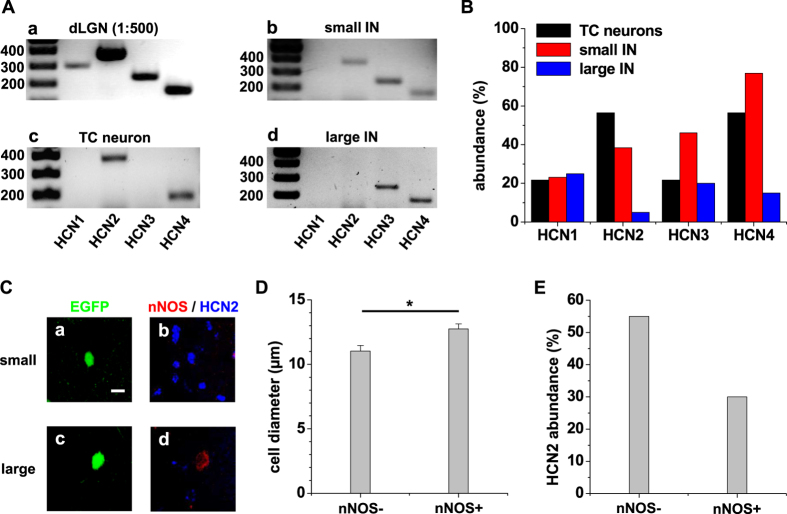
Figure 8. Analysis of HCN channel mRNA and protein expression in IN and TC neurons from dLGN.
(A) Agarose gels of dLGN tissue ((Aa) 1:500 diluted), a pool of 10 TC neurons (Ac), a pool of 10 small IN (Ab) and a pool of 10 large IN (Ad) are shown. A 100 bp ladder starting from 1000 bp was used to indicate band size. (B) Quantification of HCN isoforms detected in TC neurons (black bars), small IN (red bars) and large IN (blue bars). (C) Confocal images of EGFP-expressing neurons (Ca,Cc) stained for the protein expression of nNOS (red fluorescence) and HCN2 (blue fluorescence; (Cb,Cd) are composites of red and blue fluorescence). Note the lack of nNOS or HCN2 in a small (Ca,Cb) and a large (Cc,Cd) IN, respectively. The scale bar represents 10 μm. (D) Mean values of the somatic diameter of nNOS-negative (nNOS−) and nNOS-positive (nNOS+) cells (as indicated; Mann-Whitney test, two tailed: p < 0.05). (E) Quantification of HCN2 detection in nNOS-negative (nNOS−) and nNOS-positive (nNOS+) cells (as indicated).

