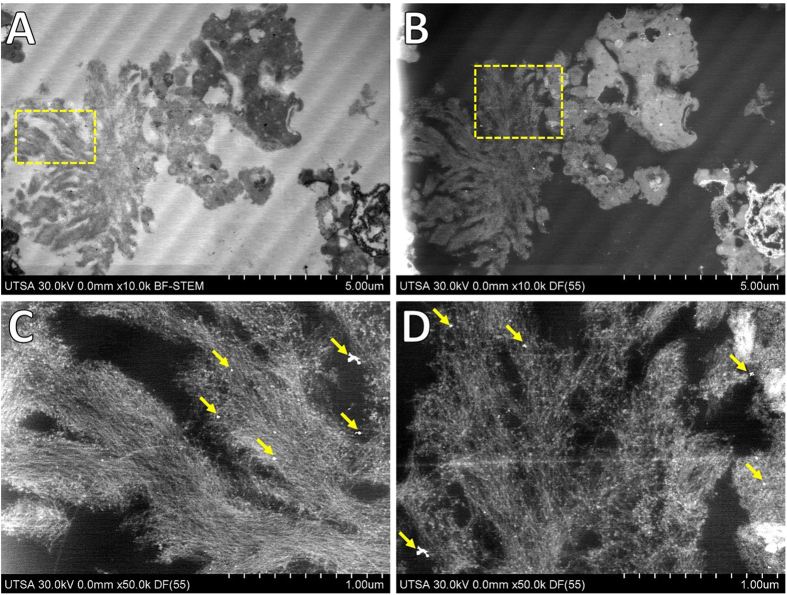
Figure 2. Imaging of ultra-thin sections of amyloid cores from AD.
(A) Low voltage BF-STEM revealed the ultra-structure and arrangements of amyloid fibers. (B) Low voltage ADF-STEM showed presence of high-contrast areas and spots within amyloid cores. (C,D) High magnification ADF-STEM imaging revealing presence of electrodense aggregates linked to amyloid fibers, indicated with yellow arrows.

