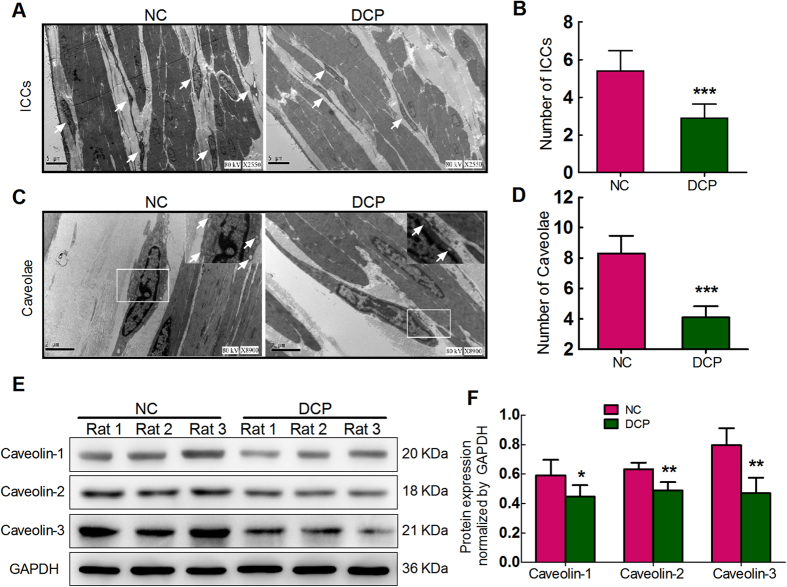
Figure 5. Down-regulation of caveolae number and Caveolin1–3 expressions in DCP bladder ICCs-DM.
Electron microscope images of bladders from NC and DCP rats showed the alterations in number of ICCs-DM and density of caveolae (A,C). Graphs showed ICCs-DM number and caveolae density of DCP bladders decreased (B,D). (E) Western blot for caveolin1–3 in total protein lysate of bladders procured from NC and DCP rats. GAPDH was used as the control. (F) Corresponding graph depicts the decreased caveolin protein expression in DCP bladders, normalized by GAPDH (n = 6, independent-sample t-test, *P < 0.05, **P < 0.01 and ***P < 0.001).

