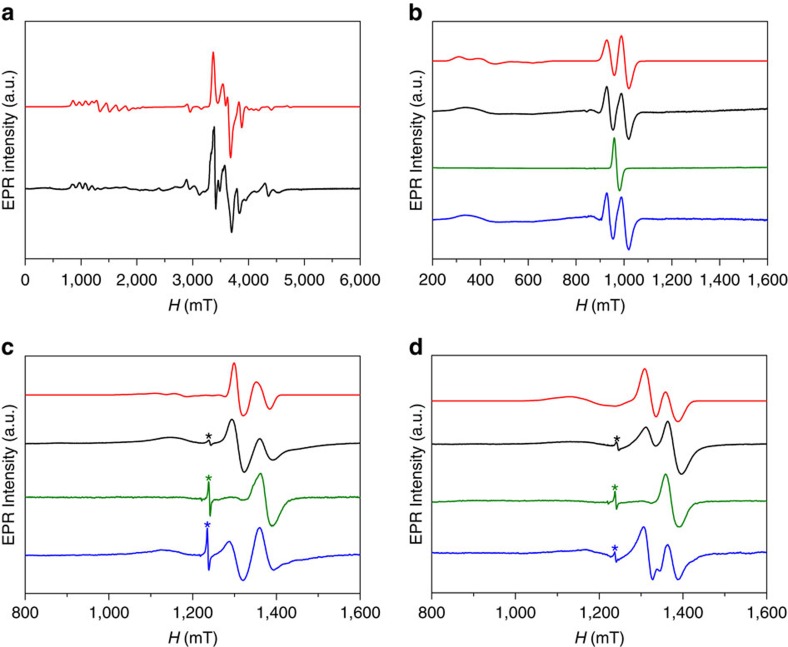
Figure 4. EPR spectroscopy of QG assemblies.
(a) Experimental powder W-band (94 GHz) EPR spectrum of 5 at 5K (black) and simulation (red) using Hamiltonian (1) and parameters in Table 1. (b) Experimental K-band (24 GHz) EPR spectra of 7 frozen solution (black), and simulation (red) using Hamiltonian (2) and parameters given in the text: experimental spectra after oxidation of 7 to 7box with [FeCp2](PF6) (ca. 3 mM, 1:1) (green), and after reducing 7box with cobaltocene (3 mM, 1:1) (blue). (c,d) Experimental Q-band (34 GHz) EPR spectra of 8b and 9b, respectively, in frozen solution (black), and simulations (red) using Hamiltonian (2) and parameters given in the text; experimental spectra after oxidation to 8box and 9box with AgBF4 (ca. 3 mM, 1:1) (green), and after reducing using with cobaltocene (3 mM, 1:1) (blue). The sharp peak marked * is a trace radical impurity.

