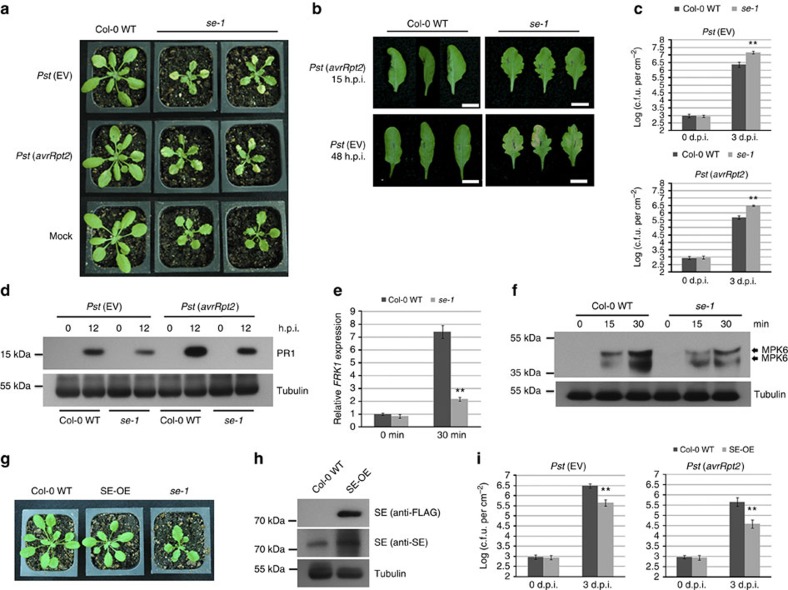
Figure 7. SE is a positive regulator of disease resistance.
(a) The se-1 mutant displays enhanced disease susceptibility phenotype after Pst (EV) and Pst (avrRpt2) infection. Bacterial inoculum concentration: 5 × 10⁵ c.f.u. per ml. Photos were taken 3 d.p.i. Mock-treated plants were used as controls. (b) The se-1 mutant shows delayed HR after Pst (avrRpt2) infection, and enhanced disease phenotype after Pst (EV) infection. Pictures were taken 15 h.p.i. of Pst (avrRpt2) infection and 48 h.p.i. of Pst (EV) infection. In all, 16 out of 18 Pst (avrRpt2)-infected Col-0 WT leaves exhibited HR at 15 h.p.i. under our conditions (three with HR are shown), while only 3 out of 18 of the se-1 leaves showed HR at 16 h.p.i. (three without HR are shown). A total of 12 out of 15 Pst (avrRpt2)-infected se-1 leaves exhibited chlorosis, while only 3 out of 15 Col-0 WT leaves did. Only half of the leaf was inoculated. Bacterial inoculum concentration: 1 × 10⁷ c.f.u. per ml. Scale bar, 10 mm. (c) The se-1 mutant is more susceptible to the infection of Pst (EV) and Pst (avrRpt2) than Col-0 WT. Bacterial inoculum concentration: 5 × 10⁵ c.f.u. per ml. Bacterial growth was measured 3 d.p.i. Error bars represent s.d. for at least 15 leaf discs. Similar results were obtained from three biological replicates. **P value <0.01 (Student's t-test). (d) PR1 protein levels in Pst (EV)- and Pst (avrRpt2)-infected Col-0 WT and se-1 mutants were detected by western blot using an anti-PR1 antibody. Bacterial inoculum concentration: 1 × 10⁷ c.f.u. per ml. Leaf tissue was collected 0 and 12 h.p.i. α-Tubulin was used as a loading control. Similar results were obtained from two biological replicates. (e) Relative expression levels of FRK1 in flg22-treated Col-0 WT and se-1 mutant were detected by real-time RT–PCR. Leaf tissue was collected 0 and 30 min after treatment. Error bars indicate s.d. from three technical replicates. Similar results were obtained in three biological replicates. **P value <0.01 (Student's t-test). (f) MPK3 and MPK6 protein levels in flg22-treated Col-0 WT and se-1 mutant were detected by western blot using monoclonal rabbit phospho-p44/42 MAPK (Erk1/2) (Thr202/Tyr204)(D13.14.4E) XP antibody. Samples were collected 0, 15 and 30 min after treatment. α-Tubulin was used as a loading control. Similar results were obtained from two biological replicates. (g) Phenotypes of 4-week-old FLAG-tagged SE overexpression lines (SE-OE), se-1 mutants and Col-0 WT plants. (h) SE protein levels were detected in Col-0 WT and FLAG-tagged SE-OE lines by western blot using anti-FLAG and anti-SE antibodies. α-Tubulin was used as a loading control. Similar results were obtained from two biological replicates. (i) Bacterial growth in Pst (EV)- and Pst (avrRpt2)-infected Col-0 WT and SE-OE lines. Bacterial inoculum concentration: 5 × 10⁵ c.f.u. per ml. Bacterial growth was measured 3 d.p.i. Error bars represent s.d. for at least 15 leaf discs. Similar results were obtained from three biological replicates. **P value <0.01 (Student's t-test).

