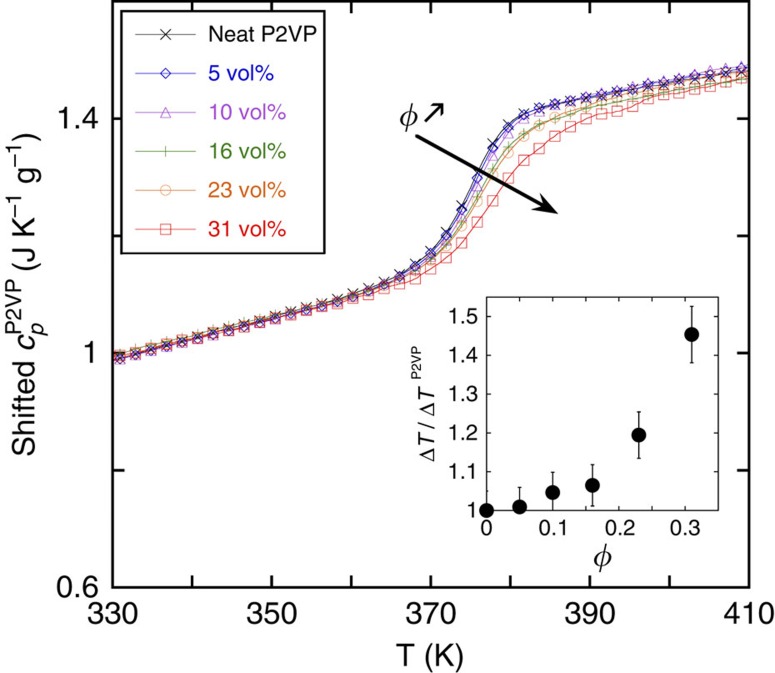
Figure 1. Glass transition broadening in nanocomposites.
Specific heat capacity of the polymer fraction as a function of the temperature for neat P2VP (554 kg mol−1) and nanocomposites loaded with 5, 10, 16, 23 and 31 vol% silica.  is calculated by subtracting the silica contribution from the nanocomposite's heat capacity as calculated in ref. 13. Note that the thermograms are arbitrarily shifted to illustrate the broadening of the glass transition. The inset is the breadth ΔT of the glass transition as a function of the filler fraction normalized by that of the neat P2VP. The error bars come from the temperature range considered around the glass transition to establish linear dependency of the heat capacity.

