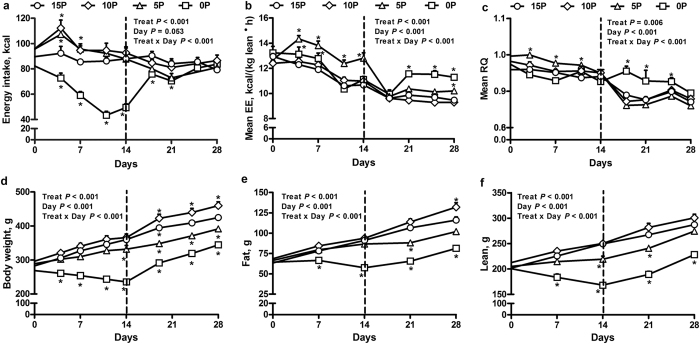
Figure 1. Effect of low protein diets on energy balance.
(a) Daily energy intake, (b) mean energy expenditure (EE), (c) mean respiratory quotient (RQ), (d) body weight, (e) body fat mass and (f) body lean mass of obesity-prone rats. The animals were fed either a control (15% protein; 15P), moderately low protein (10% protein; 10P), very low protein (5% protein; 5P) or protein-free (0% protein; 0P) isocaloric diet for 14 days, followed by a realimentation phase with ad libitum access to the control diet (15P) for another 14 days. Dotted line separates the restriction and recovery phases. Values are mean ± SEM, n = 13–16. *P < 0.05 vs 15P.

