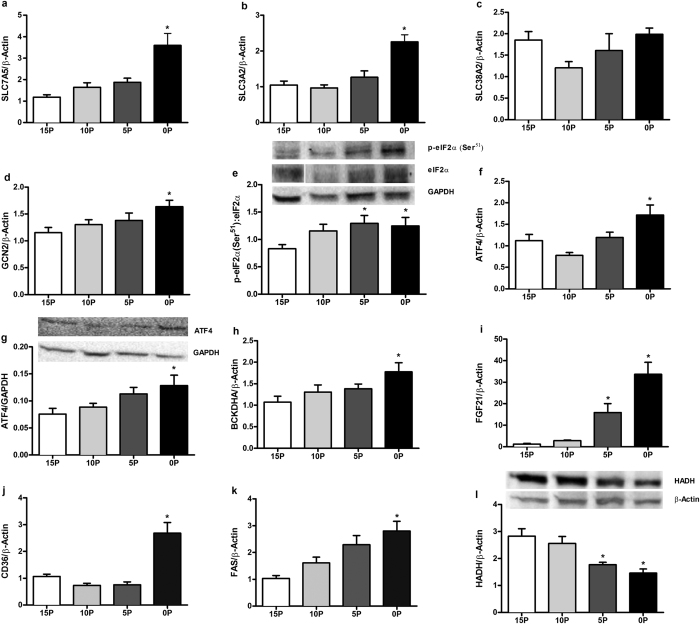
Figure 5. Effects of low protein diets on relative mRNA or protein abundance of key regulatory molecules of energy metabolism in liver.
(a) Solute carrier family 7 member 5 (SLC7A5), (b) solute carrier family 3 member 2 (SLC3A2), (c) solute carrier family 38 member 2 (SLC38A2), (d) general control non-depressible 2 (GCN2), (e) serine 51 phosphorylated eukaryotic initiation factor 2α (peIF2α (Ser51)):eIF2α ratio, (f,g) activating transcription factor 4 (ATF4), (h) branched chain keto acid dehydrogenase E1, alpha polypeptide (BCKDHA), (i) fibroblast growth factor 21 (FGF21), (j) cluster of differentiation 36 (CD36), (k) fatty acid synthase (FAS), (l) 3-hydroxyacyl-CoA dehydrogenase (HADH) in obesity-prone rats. The animals were fed a control (15% protein; 15P), moderately low protein (10% protein; 10P), very low protein (5% protein; 5P) or protein-free (0% protein; 0P) isocaloric diet for 14 days. The relative mRNA and protein abundance was determined by qPCR and immunoblot analysis. β-Actin or glyceraldehyde 3-phosphate dehydrogenase (GAPDH), were used as reference targets. The eIF2α, peIF2α (Ser51), and GAPDH were reprobed on the same blots. Values are mean ± SEM, n = 5–9. *P < 0.05 vs 15P.

