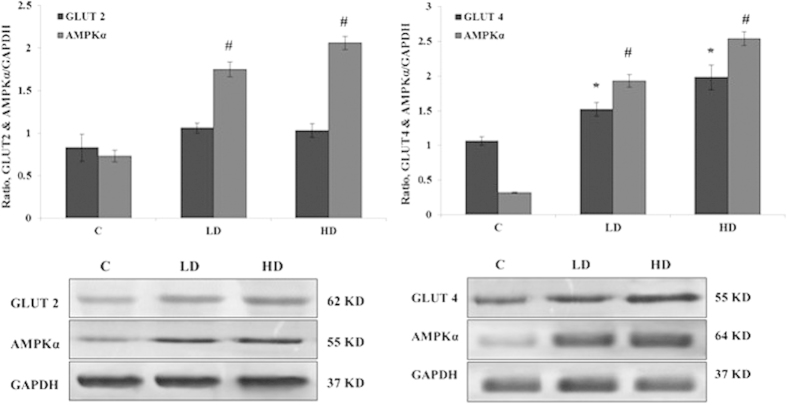
Figure 3. Western blot analysis for GLUT2, GLUT4, and AMPKα protein expression form of RIN-5F pancreatic cell and L6 myotubes cell with high or low dose of saffron treated compare to untreated.
Data were expressed as mean ± SD. C; control, LD; low dose of saffron-treated (200 μg/ml), HD; high dose of saffron-treated (400 μg/ml). #&*P value less than 0.05 considered as significant.

