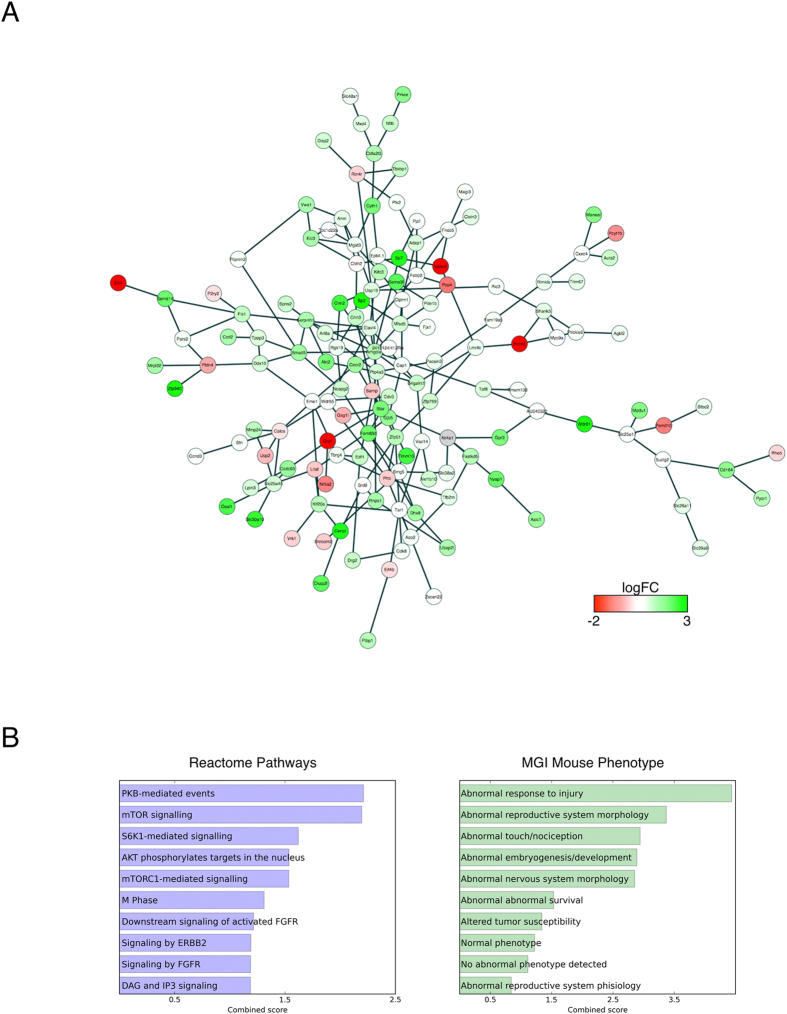
Figure 2.
(A) Active circuit of 145 genes identified by network analysis (see methods). Each node is colored by the fold change found by SAGE when comparing RCF vs. CT mice. (B) Functional analysis of the active circuit. Scores are combined for EnrichR analysis on Reactome Pathways and MGI Mouse Phenotype gene sets.

