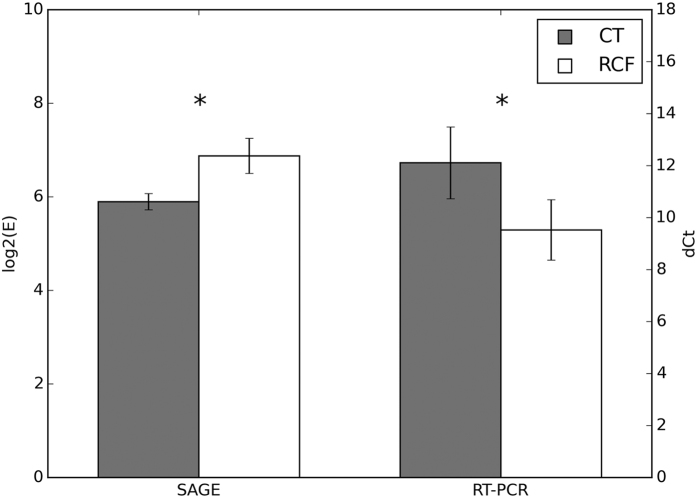
Figure 3. Asic1 gene Expression.
Histograms on the left represent mean ± SD levels of expression of Asic1 gene found by SAGE analysis in Set 2 MOs of RCF and CT mice, as described in the main text: mean log 2(E) ± SD Fold Change respectively: 6.88 ± 0.37 and 5.89 ± 0.17, p = 0.047. Histograms on the right represent mean ± SD levels of expression of Asic1 gene found by real time PCR in the MO of 5 RCF and 4 CT mice: mean ± SD of Delta Cycle Threshold (dCT) as referred to Atcb housekeeping gene, respectively: 9.52 ± 1.16 and 12.10 ± 1.38, Student t = 2.64, p = 0.033. Asterisks over the RCF bars denote significant difference in comparison to the CT group.

