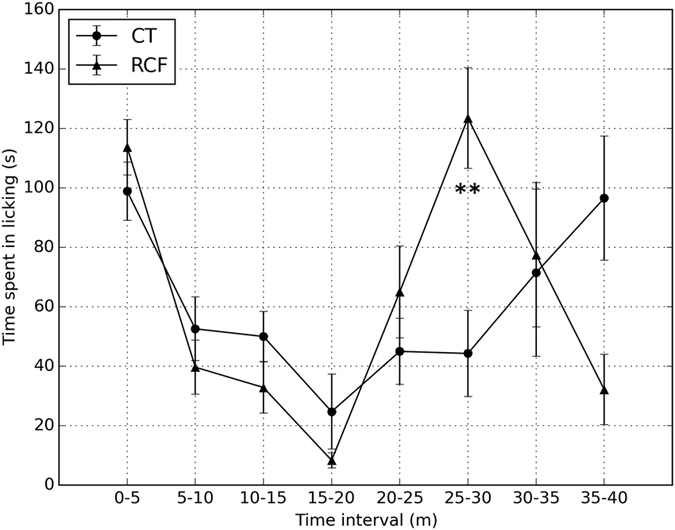
Figure 5. Nociception.

Results of the formalin test performed in 6 RCF vs. 7 CT adult (PND = 80–90) male mice. Responses were recorded continuously for 40 minutes and calculated in blocks of consecutive 5 minute periods. The figure shows the time spent licking the injected paw (Mean ± SE in seconds) for each time interval; ‘*’ and ‘**’ indicate significance of respectively p < 0.005 and p < 0.0001 when comparing RCF to CT animals at specific time intervals.
