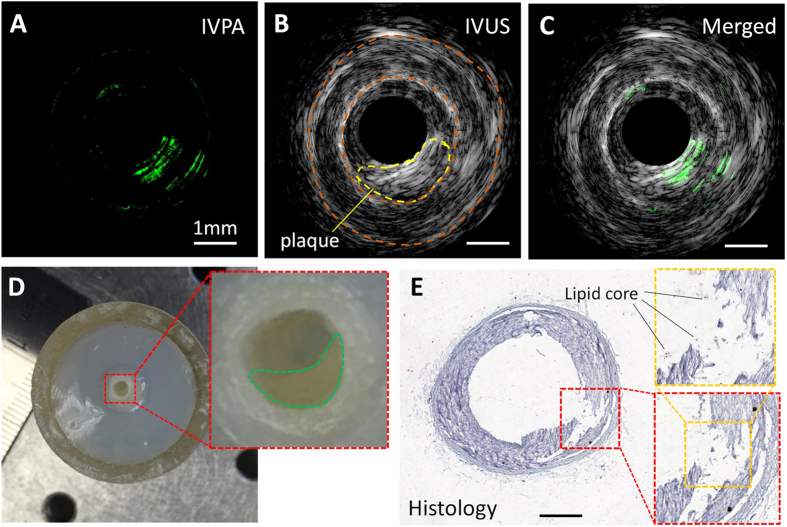
Figure 5. Co-registered IVPA/IVUS imaging of a swine carotid artery ex vivo.
(A) IVPA image. (B) IVUS image. (C) Merged IVPA/IVUS image. (D) Gross photograph of the artery segment with obstruction traced in the inset. Scale is shown by the ruler beside. (E) Histology of the cross section of the artery at the IVPA imaging position. The lipid deposition is suggested by the blank area highlighted in the box defined by yellow dashed lines. The 1 mm scale bar applies to all panels except (D).

