
Figure 5. Evolution of δ144/110Cd during the deposition of aqueous Cd in different hydrothermal fluids.
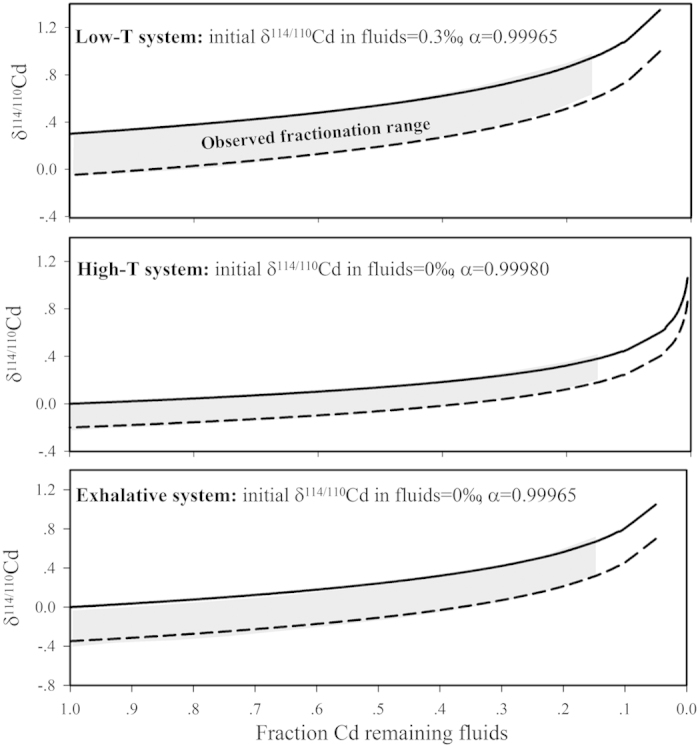
Dashed lines represent the evolution of the deposited minerals, and solid lines represent the evolution of residual aqueous Cd. The grey fields represent the observed fractionation range of the sphalerite samples.