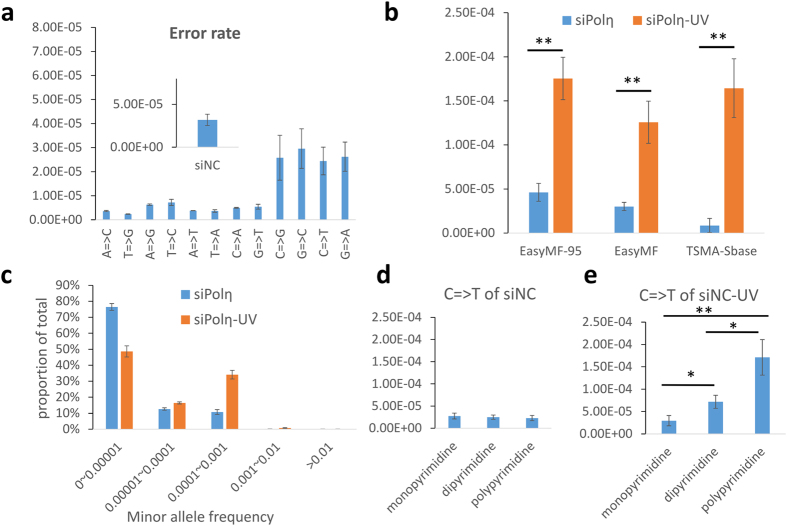
Figure 2. Mutation frequency pattern in DNA damage-induced mutagenesis measured by “EasyMF”.
(a) Background mutation frequency and mutation spectrum of “EasyMF” in undamaged pSP189 from control cells. (b) Mutation frequencies in undamaged and UV damaged pSP189 plasmids were determined after they were recovered from siPolη-treated 293T cells through “EasyMF”, “EasyMF95” (mutation frequency of every base in 95bp target region), TSMA-Sbase (mutation frequency of single base measured by TSMA). siPolη and siPolη-UV represent undamaged or UV damaged plasmid transfected into siPolη-treated 293T cells, respectively, *0.01 = <p < 0.05, **p < 0.01. (c) Distribution of mutations’ MAFs of undamaged and UV damaged pSP189 plasmids in siPolη-treated 293T cells, y axis represents the proportion of mutations, and x axis represents interval of MAFs. (d) C = >T mutation frequencies at monodipyrimidine, dipyrimidine and polypyrimidine sites of undamaged plasmid in control 293T cells. (e) C = >T mutation frequencies at monodipyrimidine, dipyrimidine and polypyrimidine sites of UV damaged plasmid in control 293T cells.

