Figure 3.
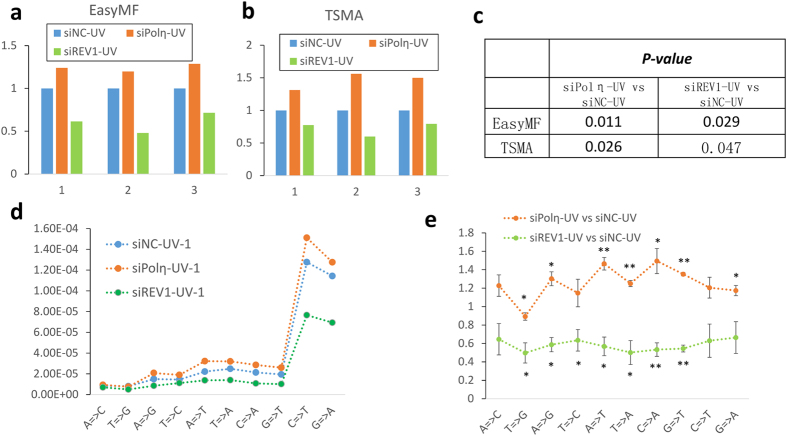
Mutation frequency changes in control, Polη or REV1 knocked down cells measured by “EasyMF” (a) and TSMA (b). X axis represents different experimental replicates, while y axis represents the fold change of mutation frequency compared with corresponding siNC-UV. (c) The p-values of siPolη-UV versus siNC-UV and siREV1-UV versus siNC-UV. (d) The effects of Polη- or REV1-depletion on the base substitution frequencies of UV damaged pSP189 plasmid, one replicate was showed, another two were showed in Fig. S8. (e) The significance statistical analysis of base substitution of siPolη-UV and siREV1-UV compared with siNC-UV. Y axis is the fold changes of mutation frequency for each types of base substitutions.

