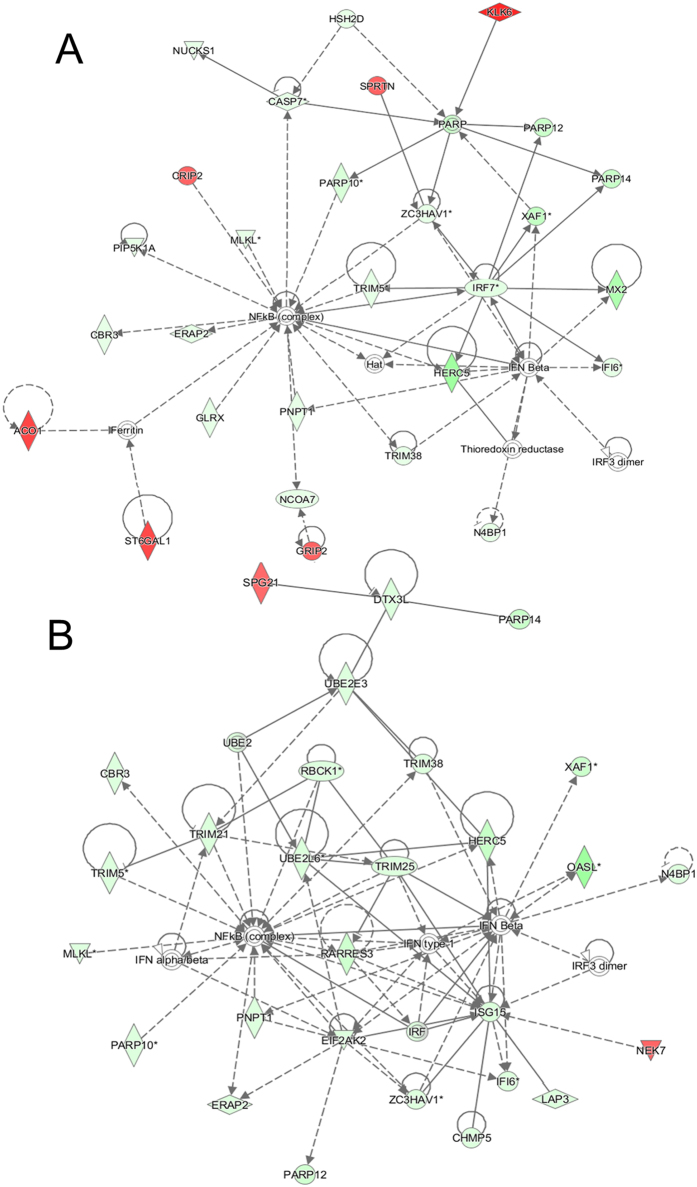
Figure 1. Highest confidence network of genes displaying altered expression by miR-204/211 in MCF-7.
The highest confidence network was constructed using IPA from 453 and 384 dysregulated genes by miR-204 (A) and miR-211 (B), respectively. The top network was “Infectious Disease, Auditory Disease, and Cancer” for miR-204 and “Infectious Disease, Cell Signaling, Cell-To-Cell Signaling, and Interaction” for miR-211. Upregulated genes are shaded in red, while downregulated genes are shaded in green, with the color intensity signifying the magnitude of expression change. Solid and dashed lines represent direct and indirect interactions, respectively. Networks for miR-204/211 in MCF-10A are given in Supplementary Fig. S2.

