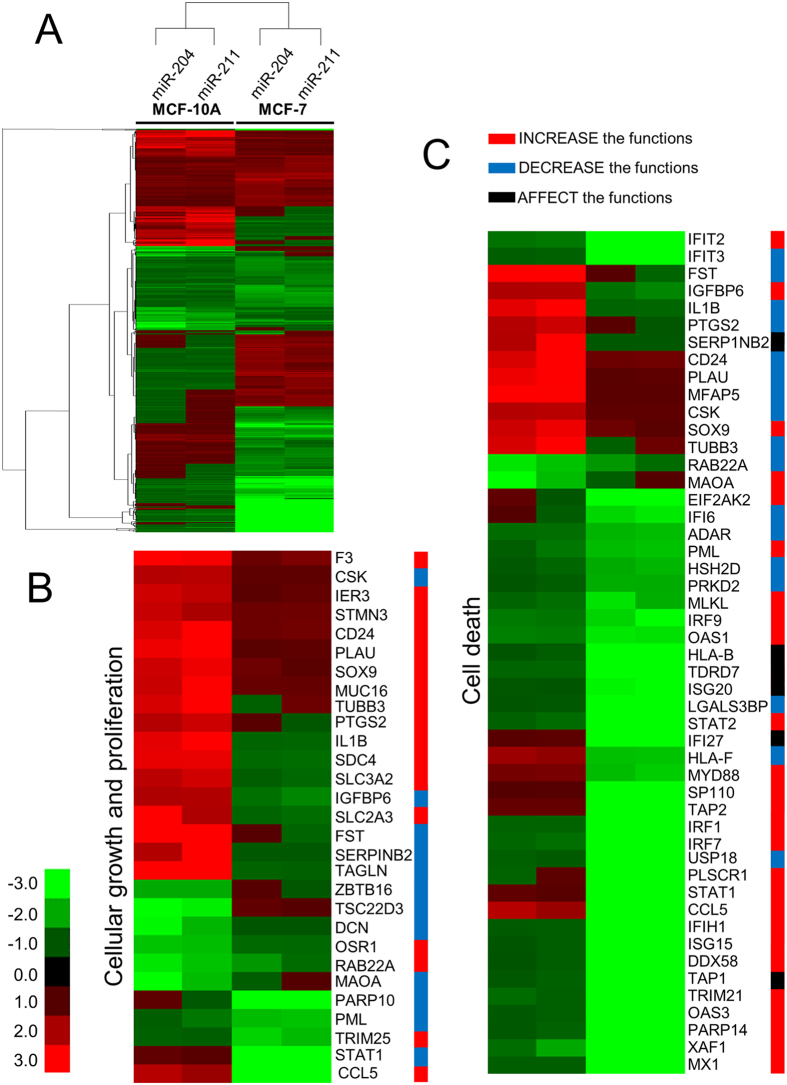
Figure 3. Hierarchical clustering of genes affected by miR-204/211 in MCF-10A and MCF-7.
(A) The heatmap was constructed with genes dysregulated by miR-204 or miR-211. Each column represents gene expression change by the indicated miR overexpressed in MCF-10A or MCF-7. If a gene satisfies the criteria of differential expression (≥1.5), at least in one of the four samples, it is adopted for comparison. The genes with the green color are “downregulated,” whereas the red color signifies “upregulated” compared to those in mock miR-overexpressing cells. Of the genes that appeared in panel (A), the ones related to “cellular growth and proliferation” (B) and “cell death” (C) were clustered in separate heatmaps. The colored bar to the right of the gene symbol signifies the activity of the cellular biofunctions based on information from Qiagen (http://www.sabiosciences.com/pathwaysonline/). Genes in red and blue bar indicate that their expression is changed to directions to increase and decrease the functions, respectively. Genes in black bar are to affect the function.

