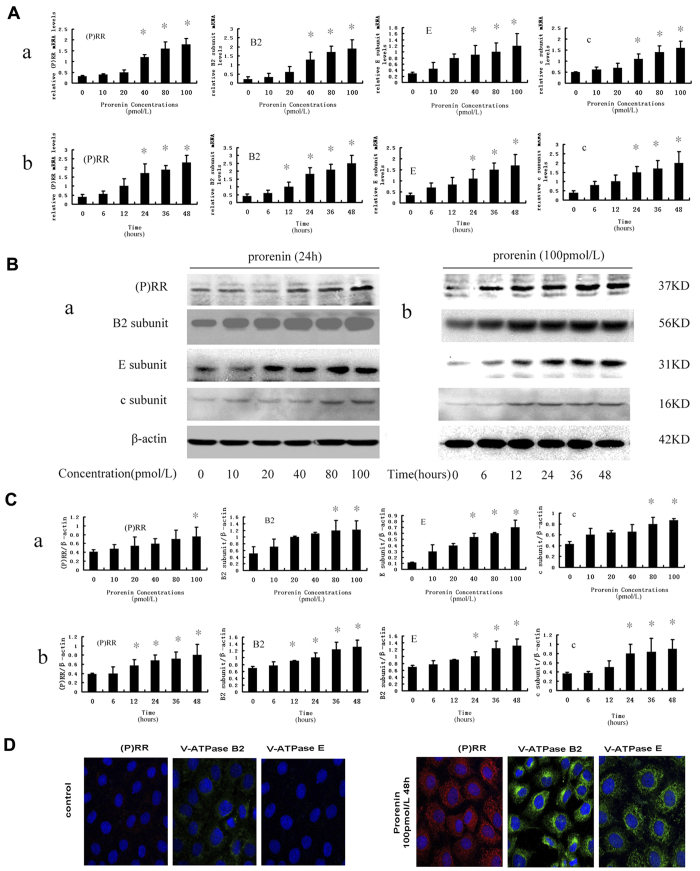
Figure 3. Expression of (P) RR, V-ATPase B2, E, and c subunit in NRK52E cells increased in a dose- and time-dependent manner after prorenin treatment.
(A) Real-time PCR analysis showed mRNA expression of (P) RR, V-ATPase B2, E, and c subunit increased at a dose- (A-a) and time-dependent manner (A-b) after prorenin stimulation. Values are means ± SD; n = 4. *P < 0.05 vs. control group (0 hour or 0 pmol/L). (B) Western blot analysis showed the protein levels of (P) RR, V-ATPaseB2, E, and c subunits were also increased at a dose- (B-a) and time-dependent (B-b) manner. (C) Graphic representation of (P) RR, V-ATPase B2, E, and c protein levels in different groups (C-a showed as different dose treated and C-b as different times treated) as indicated after normalization with β-actin content. Values are means ± SD; n = 4. *P < 0.05 vs. control group (0 hour or 0 pmol/L). (D) Immunofluorescence staining demonstrated that the expression of (P) RR (red), V-ATPaseB2, E subunits (green) in NRK52E cells were significantly increased after stimulation with 100 pmol/L prorenin for 48 h. Nucleus was stained with DAPI (4, 6-diamidino-2-phenylindole) (blue). Confocal ×40 ocular.

