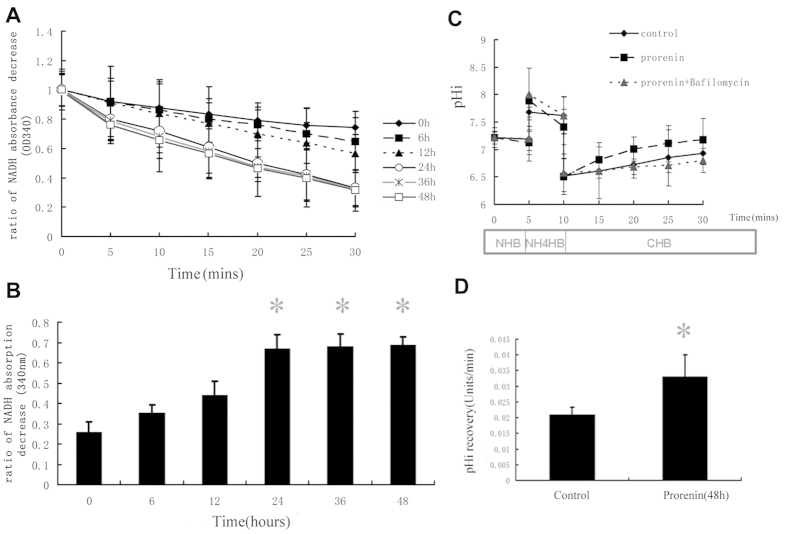
Figure 5. Effect of prorenin on hydrolysis activity of the ATPase and the proton-translocating activity of V-ATPase in NRK52E cells.
The ATPase activity of the whole cell homogenates (60 μg) of NRK52E cells in different stimulated groups were measured by ATP/NADH-coupled assay. (A) Line graph showed as the results of ATP/NADH-coupled assay in different stimulated groups. (B) Bar graph showed the ratio of NADH absorption decrease at OD340 (ATP hydrolysis), and blanked against the cell lysis buffer (negative control). Control group (prorenin, 0 h) had measurable ATPase activity (0.259 ± 0.05 OD units/min, n = 6). After stimulation with prorenin, ATPase activity was increased significantly on 24, 36 and 48 h (0.670 ± 0.07, 0.681 ± 0.06, 0.688 ± 0.04 OD units/min, respectively P < 0.05, n = 6). Values are with means ± SD; *P < 0.05 vs. Control group. The Na+-independent intracellular pH (pHi) recovery after acute cellular acidification methods was measured as the proton-translocating activity of V-ATPase. (C) Cell pHi was determined with a fluorescence probe SNARF-4F. NRK 52E cells were bathed in a 110 mM Na+ solution (NHB), in which the basal pHi was 7.21 ± 0.12 (n = 6). After 5 min of exposure to NH4Cl, during which pHi increased transiently to 7.68 ± 0.32 (n = 6), NH4Cl removal caused a rapid acidification of pHi (6.51 ± 0.33, n = 6) as a result of NH3 efflux. Subsequently, the effect of a Na+-free solution (CHB) on the pH recovery of NRK52E cells, which was mainly mediated by V-ATPase, was depicted in the control groups (♦), prorenin-stimulated groups (■), and prorenin-stimulated in the presence of bafilomycin A1 groups (▲). (B) The rate of pHi recovery of control and prorenin stimulated group. Values are means ± SD. *P < 0.05 vs. control.

