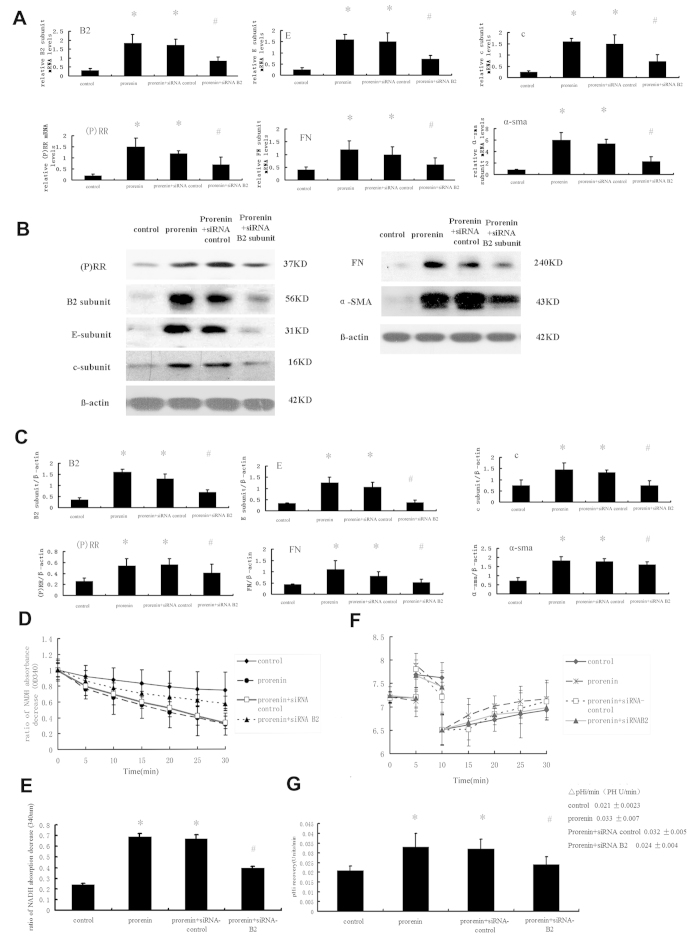
Figure 8. Effects of small interfering (si) RNA-mediated silencing of V-ATPase B2 subunit on expression of fibrosis marker (FN and α-SMA), (P) RR, and other V-ATPase subunits (E and c), and V-ATPase activity in NRK52E cells after stimulation by prorenin (100 pmol/L) for 48 hours.
Cells were divided into the four groups as follows: control group, prorenin-treated group, prorenin-treated group transfected with non-silencing siRNA (siRNA-control) or specific V-ATPase B2 subunit siRNAs (siRNA-B2). (A) mRNA levels of (P) RR, V-ATPase subunits (B2, E, and c), and fibrosis marker (FN and α-SMA) in NRK52E cells by groups. Values are with means ± SD; n = 6; *P < 0.05 vs. control group, #P < 0.05 vs. prorenin-treated group. (B) Western blots analysis of (P) RR, V-ATPase subunits (B2, E, and c), and fibrosis marker (FN and α-SMA) in NRK52E cells by groups. (C) Graphic representation of the protein levels. Values are with means ± SD; n = 6; *P < 0.05 vs. control group, #P < 0.05 vs. prorenin-treated group. (D) Line graph showed as the results of ATP/NADH-coupled assay in different stimulated groups. (E) Bar graph showed the ratio of NADH absorption decrease at OD340 (ATP hydrolysis), and compared to the prorenin treated group, ATPase activity in the siRNA-B2 group was lower (0.400 ± 0.013 vs. 0.689 ± 0.03 OD units/min, P < 0.05). Values are presented as means ± SD; n = 6; *P < 0.05 vs. control group, #P < 0.05 vs. prorenin-treated group. (F) The Na+-independent intracellular pH (pHi) recovery after acute cellular acidification methods was measured as the proton-translocating activity of V-ATPase by groups. The effect of a Na+-free solution (CHB) on the pH recovery of NRK52E cells, which was mainly mediated by V-ATPase, was depicted in the control groups (♦), prorenin-stimulated groups (*), and prorenin-treated group transfected with non-silencing siRNA (siRNA-control) (□) or specific V-ATPase B2 subunit siRNAs (▲). (G) The rate of pHi recovery of different groups. Values are with means ± SD; n = 6. *P < 0.05 vs. control group, #P < 0.05 vs. prorenin-treated group.

