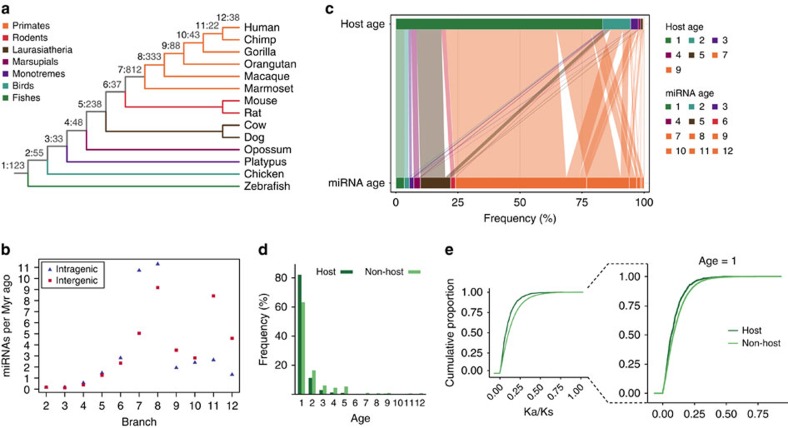
Figure 1. Evolutionary ages of human inter- and intragenic miRNAs and their host genes.
(a) MiRNA distribution along the vertebrate phylogenetic tree. Numbers in grey indicate the amount of miRNAs (miRBase 20) emerged in each phylogenetic branch (1–12). (b) Number of human inter- and intragenic miRNAs across the vertebrate lineage. Numbers of miRNAs per million years (Myr ago) were calculated by the ratio of inter- or intragenic miRNAs emerged in each branch to the time elapsed from the previous branch. For example, the gain rate of intergenic miRNAs in branch 2 (chicken) is given by Ninter/Db12−b1−Db12−b2, where Ninter is the number of intergenic miRNAs emerged in branch 2; Db12−b1 is the divergence time between branches 12 (human) and 1 (fish) and Db12−b2 is the divergence time between branches 12 and 2. Divergence times were obtained from timetree.org. (c) Age relationships among intragenic miRNAs and their host genes. Horizontal line lengths are proportional to the frequency of miRNAs and host genes of each age. (d) Host and non-host genes' frequency according to their ages. Single exon genes were excluded to avoid new gene bias in non-host genes due to excess of retrogenes. (e) Ka/Ks cumulative distributions for host and non-host genes. Distribution for old genes (age=1) is shown in detail.

