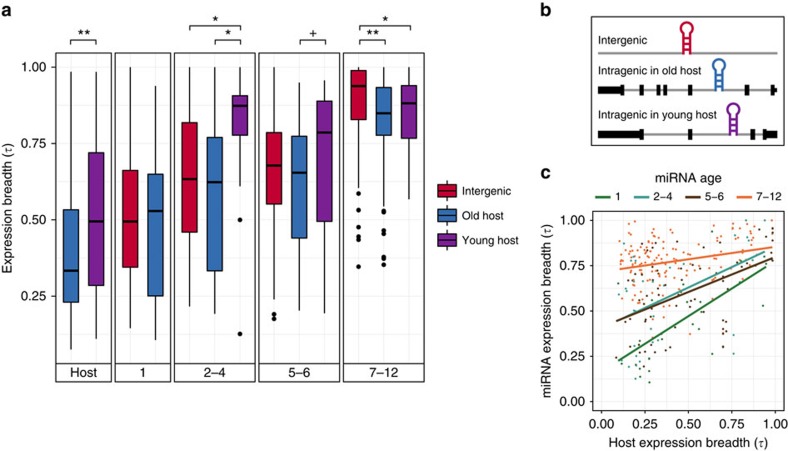
Figure 2. Human miRNA expression breadth according to age and genomic context.
(a) Box plots of expression breadth calculated using the tissue specificity index (τ). Higher τ indicates more tissue specificity. First box represents the expression breadth of old (blue) and young (purple) host genes. The subsequent boxes correspond to the expression breadth of intergenic miRNAs (red), intragenic miRNAs within old hosts (blue) and intragenic miRNAs within young hosts (purple), according to miRNAs' age classes (1: vertebrates, 2–4: amniotes, 5–6: placental mammals and 7–12: primates). Significant differences in τ were assessed by Mann–Whitney tests (+P=0.07; *P<0.05; **P<0.001). (b) Schematic representation of the miRNA genomic contexts considered in our analyses. (c) Correlations between expression breadth of intragenic miRNAs and of their host genes according to miRNA age class. Significant correlations were observed for all ages (age 1: ρ=0.67, P<0.001; age 2–4: ρ=0.36, P=0.03; age 5–6: ρ=0.47, P<0.001; age 7–12: ρ=0.20, P=0.01, Spearman rank correlations).

