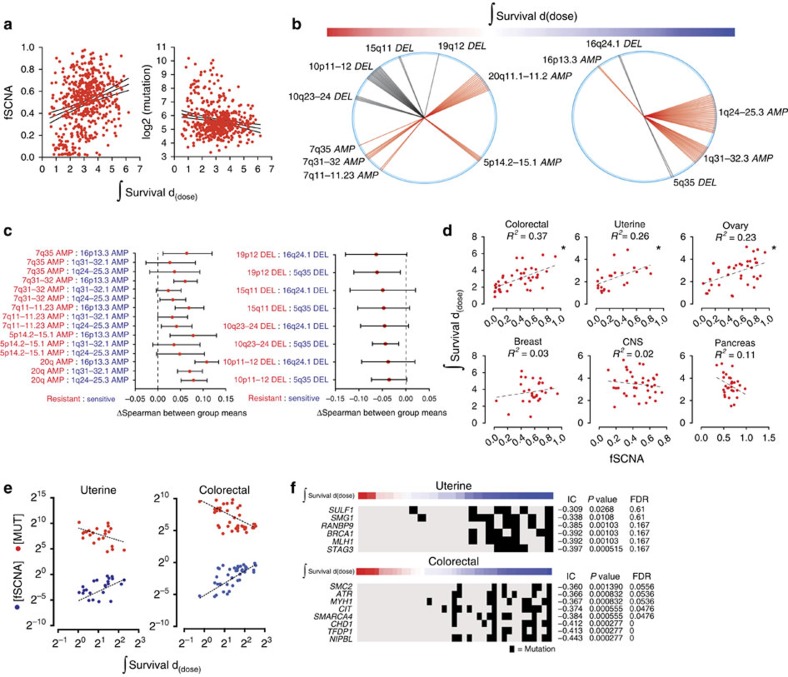
Figure 2. SCNA changes are associated with survival after radiation-induced damage.
(a) Plots of fSCNA, integral survival, and number of mutations per sample. (b) The top 50 probes that correlate with radiation resistance (left) and sensitivity (right) are shown. Radii (single probe) or sectors (multiple probes) correspond to chromosome positions. Each radius represents a distinct probe that mapped to the designated chromosome position. (c) Individual SCNA can regulate the response to radiation directly. We correlated radiation survival with the expression of genes within the altered segments and compared the means of the coefficients by pairwise analysis, resistant (red) versus sensitive (blue). Spearman means for alterations depicted in (b) were analysed by analysis of variance and Tukey Contrasts. 95% confidence level intervals for each pairwise comparison are shown. (d) Scatter plots, linear regression, and R2 values of the integral survival and fSCNA by lineage. (e) Scatter plot and linear regression of integral survival, fSCNA, and the number of mutations (MUT) in uterine and colorectal carcinoma. (f) Heatmap of integral survival (red=resistant, blue=sensitive) and gene mutations in uterine and colorectal carcinoma cells. Black bar represents a mutation in the corresponding gene.

