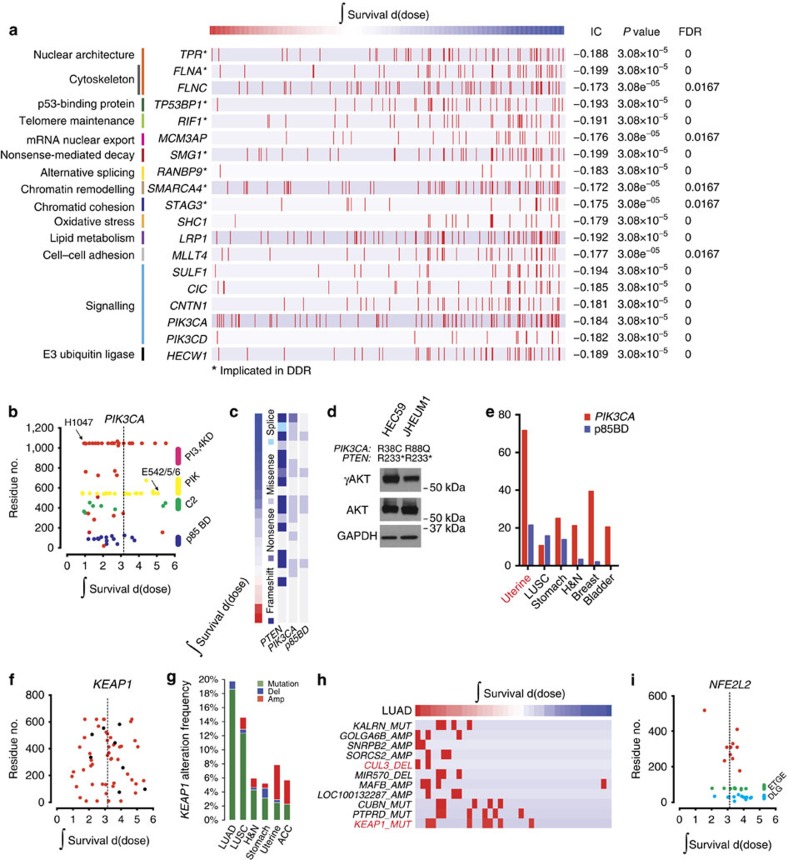
Figure 3. Mutations in genes associated with distinct cellular functions correlate with survival after radiation-induced damage.
(a) Top 19 genes that when mutated are associated with radiation sensitivity are organized by biological functions. Red bars represent samples with a mutation. (b) Scatter plot of integral survival and amino acid position for cell lines containing mutations in PIK3CA. (c) Association between radiation response and mutation in PIK3CA and PTEN in uterine carcinoma. (d) γAKT, AKT, and GAPDH levels in two uterine cancer cell lines with p85 BD mutations. (e) Frequency of PIK3CA and PIK3CA p85 BD mutations as annotated by TCGA; organized from left to right by frequency of mutations in p85 BD. (f,i) Scatter plot of integral survival and amino acid position for cell lines containing mutations in KEAP1 and NFE2L2. (g) KEAP1 alteration frequency by lineage, and sub-lineage where appropriate, as annotated by TCGA. Organized from left to right by frequency of KEAP1 mutation. (h) Association between integral survival and genomic features in lung adenocarcinoma. Red bar represents a copy number change or mutation in the corresponding gene.

