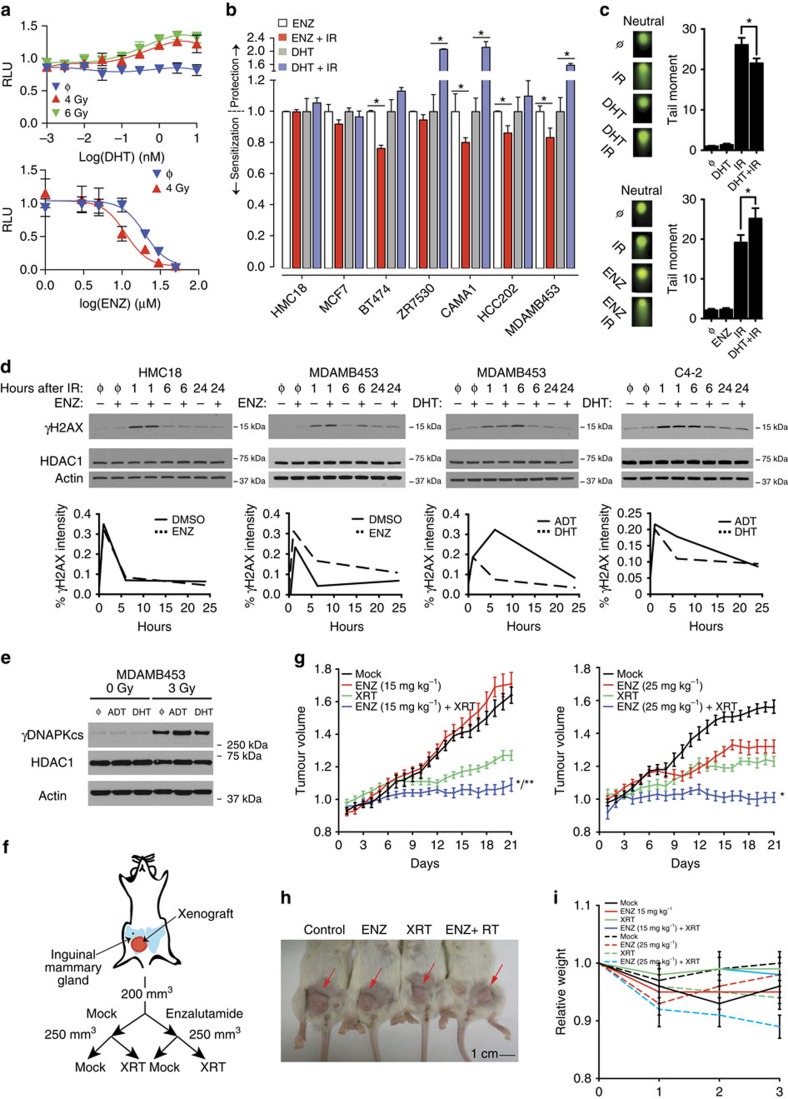
Figure 6. AR activity regulates the response to DNA damage in breast carcinoma.
(a) (Top) Cells were cultured in steroid-deprived media −/+ DHT for 24 h and then treated with IR: mock (φ), 4 Gy or 6 Gy. Cells were then supplemented with hormone-proficient media at 48 h post-IR. Cell number was determined on day 14–21. (Bottom) Cells were cultured in hormone-proficient media for 24 h without or with enzalutamide (ENZ) and then treated with IR; mock (φ) or 4 Gy. Error bars represent normalized s.e.m. of at least three experiments. (b) MCF7, BT474, CAMA1, HCC202 and MDAMB453 cells were treated with ENZ, ENZ+IR, DHT or DHT+IR as in a. HMC18 cells were treated similarly but were profiled by clonogenic survival assays. Error bars represent normalized s.e.m. of at least three experiments and the Student's t-test was used for statistical analysis. *P<0.05. (c) Neutral Comet assay of MDAMB453 cell line, showing increased double-strand breaks when cells were irradiated in steroid-deprived conditions (left) or after 24 h of treatment with 20 μM of ENZ (right). Error bars represent s.e.m. of at least three experiments and the Student's t-test was used for statistical analysis. *P<0.05. (d) Cells were cultured in hormone-proficient (FBS) media for 24 h −/+ ENZ and then treated with IR: mock (φ), 3 Gy (HMC18 and MDAMB453), or 2 Gy (C4–2). Cells were cultured in steroid-deprived media for 48 h, treated −/+ DHT for 24 h, and then treated with IR: mock (φ), 3 Gy (HMC18 and MDAMB453), or 2 Gy (C4–2). γH2AX, HDAC1, and actin levels were measured at the indicated time points. Relative intensity of γH2AX was calculated by ImageJ64. (e) MDAMB453 cells were cultured in steroid-replete, steroid-deficient, or steroid-deficient with 1 nM DHT for 24 h, then treated with irradiation. Cells were harvested and expression of γDNAPKcs was analysed. Androgen deprivation therapy (ADT). (f) Schematic of treatment arms. (g) MDAMB453 cells were orthotopically injected into the mammary gland of NSG mice and block randomized into one of four treatment arms as shown. Tumour volume was measured daily. Error bars represent normalized s.e.m. of at least seven mice in each treatment arm. *P<0.05 compared with all other treatment conditions based on analysis of variance (ANOVA) and Tukey Contrasts. **P<0.05 for interaction based on two-way ANOVA. (h) Pictorial depiction of representative mice from each arm of cohort 2 at the end of treatment. This cohort received ENZ at 25 mg kg−1. (i) Average weight for each arm in both cohorts was measured weekly. Data are expressed as the means±s.e. of at least seven mice in each treatment arm.

