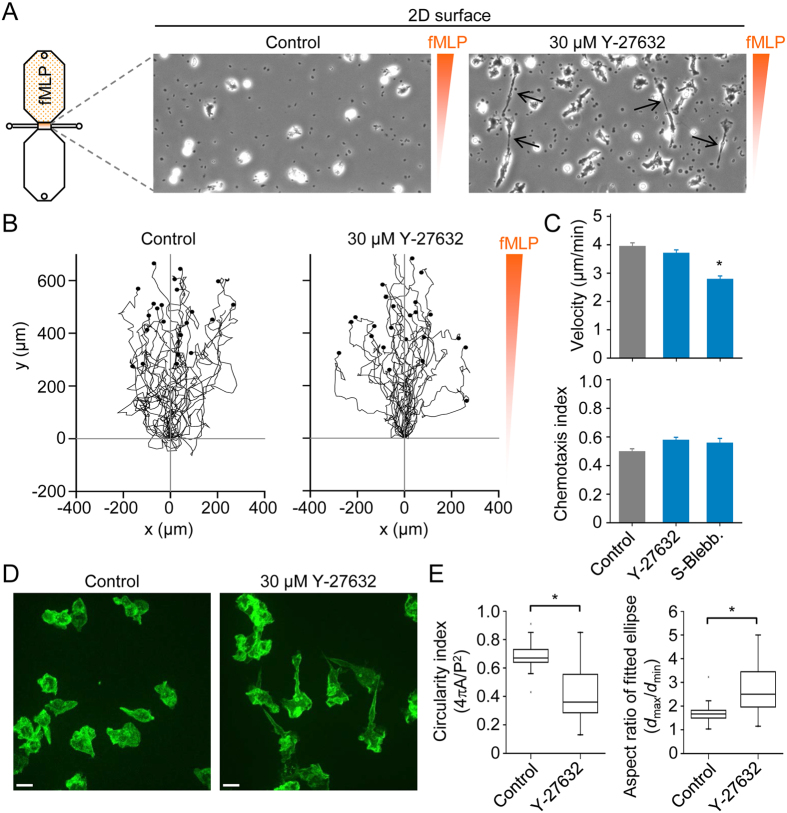
Figure 2. 2D chemotaxis assays and effects of ROCK (Rho kinase) and nonmuscle myosin II inhibitors.
(A) Schematic diagram of a chemotaxis μ-slide, which consists of two 40 μl reservoirs connected by a narrow channel, and phase-contrast snapshots (200 × 400 μm) of cells in the absence (control) or presence of a ROCK inhibitor (Y-27632). The small dark spots are platelets, and the black arrows indicate elongated trailing ends in the presence of Y-27632. (B) Migration tracks of monocytes (in a chemotactic fMLP gradient) in the absence of inhibitors (control) or in the presence of Y-27632. Plots were generated by tracking 25 cells (monocytes) and normalizing the start point to x = 0 and y = 0. The y-axis represents the direction of the chemoattractant (fMLP) source. (C) Summary data for control, 30 μM Y-27632 and 50 μM S-blebbistatin (S-Blebb.) groups. Data are shown as mean ± s.e.m. for tracked cells (25 per experiment) pooled from three independent experiments for each group. *p < 0.05; Kruskal-Wallis one way analysis of variance on ranks and Dunn’s method for post-hoc comparisons. (D) Projected (extended focus) fluorescence images, obtained by spinning disk confocal microscopy, of purified monocytes in the absence (control) or presence of Y-27632. (E) Cell shape analysis of control (n = 59) and Y-27632 treated (n = 36) cells. Circularity is a function of the cell perimeter (P) and cell area (A), whereas the aspect ratio is a function of the largest diameter (dmax) and smallest diameter (dmin), after fitting an ellipse to the cell.

