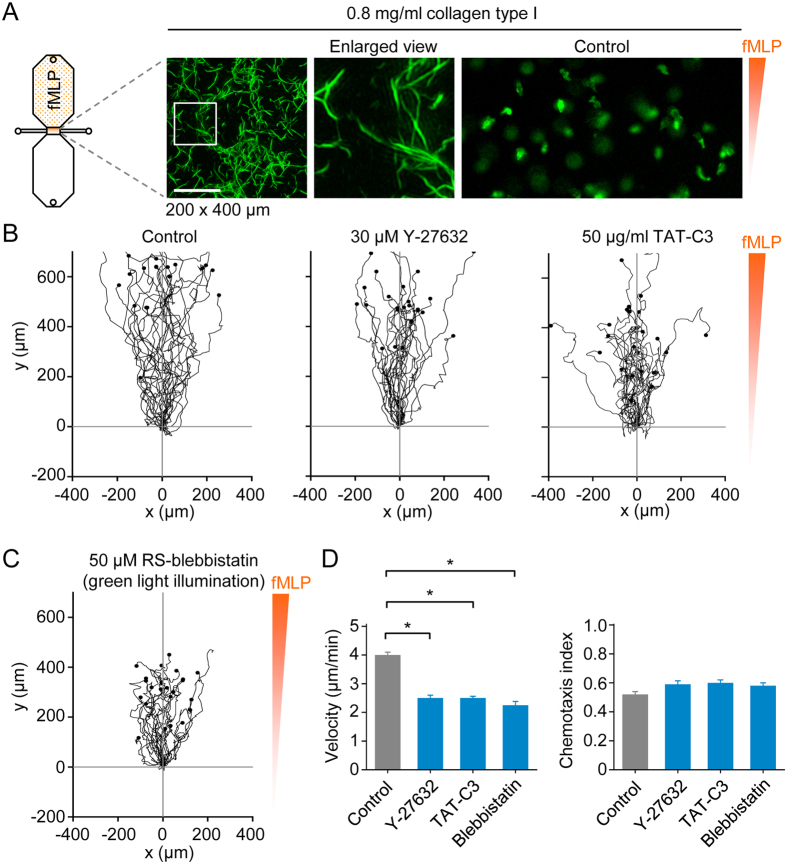
Figure 5. 3D chemotaxis assays of monocytes in a loose collagen type I matrix.
(A) Maximum intensity projection of collagen type I fibers in a loose matrix (0.8 mg/ml collagen), obtained by picrosirius red staining and superresolution structured illumination microscopy, and snapshot (200 × 400 μm) of fluorescently labeled monocytes, in a loose 3D collagen matrix, migrating in a chemotactic fMLP gradient. Scale bar: 10 μm. (B) Migration tracks of monocytes (in a loose collagen type I matrix and chemotactic fMLP gradient) in the absence of inhibitors (control) or in the presence of a ROCK inhibitor (Y-27632) or Rho inhibitor (TAT-C3). (C) Migration tracks of monocytes (in a loose collagen type I matrix and chemotactic fMLP gradient) in the presence of a nonmuscle myosin II inhibitor (blebbistatin). To circumvent phototoxicity, cells were labeled with a red fluorescent dye and illuminated with green light. (D) Summary data. Data are shown as mean ± s.e.m. for tracked cells (25 per experiment) pooled from two to four independent experiments for each group. *p < 0.05; Kruskal-Wallis one way analysis of variance on ranks and Dunn’s method for post-hoc comparisons.

