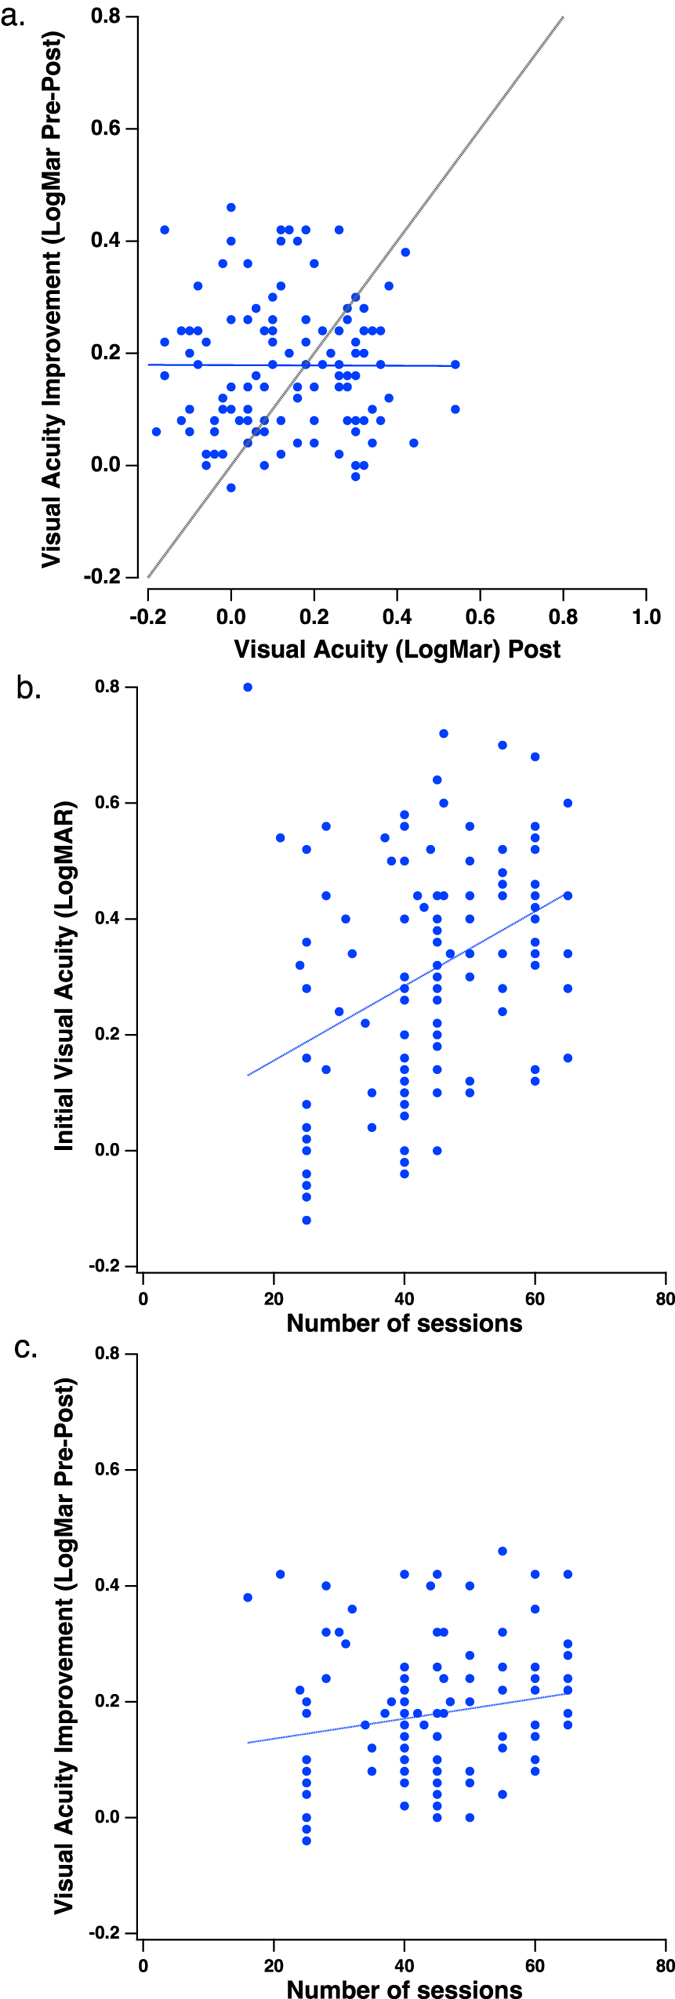
Figure 4. Estimates of VA improvement.

(a) Improvement in LogMAR (LogMAR Pre-LogMAR Post) vs LogMAR Post. The solid blue line is the best fitting regression line, with a slope of −0.0025. The gray line is the unity line. (b) Initial VA as a function of the number of training sessions. The blue line is the best fitting regression line, with a slope of 0.0064. (c) VA improvement as a function of the number of training sessions. The blue line is the best fitting regression line, with a slope of 0.0017.
