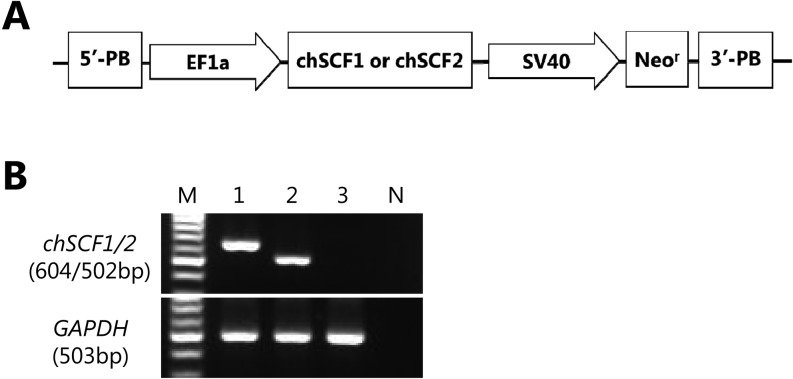
Fig. 2.
Establishment and characterization of chSCF1 or chSCF2-BRL cells. A) Schematic of the piggyBac chSCF1 and chSCF2 expression vectors. PB, piggyBac repetitive elements; EF1a, EF1a promoter; SV40, SV40 promoter; Neor, neomycin resistance. B) RT-PCR analysis of chSCF1-BRL cells, chSCF2-BRL cells and normal BRL cells. The 604-bp and 502-bp bands in the upper panel indicate chSCF1- or chSCF2-derived amplification products, respectively, and the 503-bp band in the lower panel indicates rat GAPDH-derived amplification products. M, Molecular size marker; 1, chSCF1-BRL cells; 2, chSCF2-BRL cells; 3, normal BRL cells; N, no cDNA control.

